[Preprint]. 2024 Sep 5:2024.09.05.611469.
doi: 10.1101/2024.09.05.611469.

SARS-CoV-2 Nsp15 antagonizes the cGAS-STING-mediated antiviral innate immune responses

Affiliations

SARS-CoV-2 Nsp15 antagonizes the cGAS-STING-mediated antiviral innate immune responses

Hsin-Ping Chiu et al. bioRxiv. .

Abstract

Coronavirus (CoV) Nsp15 is a viral endoribonuclease (EndoU) with a preference for uridine residues. CoV Nsp15 is an innate immune antagonist which prevents dsRNA sensor recognition and stress granule formation by targeting viral and host RNAs. SARS-CoV-2 restricts and delays the host antiviral innate immune responses through multiple viral proteins, but the role of SARS-CoV-2 Nsp15 in innate immune evasion is not completely understood. Here, we generate an EndoU activity knockout rSARS-CoV-2Nsp15-H234A to elucidate the biological functions of Nsp15. Relative to wild-type rSARS-CoV-2, replication of rSARS-CoV-2Nsp15-H234A was significantly decreased in IFN-responsive A549-ACE2 cells but not in its STAT1 knockout counterpart. Transcriptomic analysis revealed upregulation of innate immune response genes in cells infected with rSARS-CoV-2Nsp15-H234A relative to wild-type virus, including cGAS-STING, cytosolic DNA sensors activated by both DNA and RNA viruses. Treatment with STING inhibitors H-151 and SN-011 rescued the attenuated phenotype of rSARS-CoV-2Nsp15-H234A. SARS-CoV-2 Nsp15 inhibited cGAS-STING-mediated IFN-β promoter and NF-κB reporter activity, as well as facilitated the replication of EV-D68 and NDV by diminishing cGAS and STING expression and downstream innate immune responses. Notably, the decline in cGAS and STING was also apparent during SARS-CoV-2 infection. The EndoU activity was essential for SARS-CoV-2 Nsp15-mediated cGAS and STING downregulation, but not all HCoV Nsp15 share the consistent substrate selectivity. In the hamster model, rSARS-CoV-2Nsp15-H234A replicated to lower titers in the nasal turbinates and lungs and induced higher innate immune responses. Collectively, our findings exhibit that SARS-CoV-2 Nsp15 serves as a host innate immune antagonist by targeting host cGAS and STING.

Keywords: Biological Sciences/Microbiology; Nsp15; SARS-CoV-2; cGAS-STING; innate immunity.


Conflict of interest statement

Competing Interest Statement: S.J. is a co-founder of Elucidate Bio Inc, has received speaking honorariums from Cell Signaling Technology, and has received research support from Roche unrelated to this work.

Figures
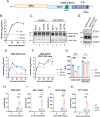
Fig. 1
Fig. 1. Infection of Nsp15 wild-type and mutant SARS-CoV-2 in Vero E6 and A549-ACE2 cells.
(A) Schematic diagram of the recombinant SARS-CoV-2 genome with Nsp15 H234A and N277A mutations. (B) Replication kinetics of Nsp15WT, Nsp15H234A, and Nsp15N277A rSARS-CoV-2 in Vero E6 cells (MOI of 0.001). (C) Cell lysates from mock- and virus-infected Vero E6 cells (MOI of 0.001) after 48 h of infection were incubated with anti-Nsp15 antibody or isotype control. Immunoblot analysis applied for the immunoprecipitated Nsp15 proteins. (D) Western blot for ACE2 and STAT1 in A549-ACE2 cells with or without STAT1 knockout. (E and F) Replication kinetics of Nsp15WT, Nsp15H234A, and Nsp15N277A rSARS-CoV-2 in A549-ACE2 and A549-ACE2/STAT1 KO cells (MOI of 1). (G) The area under the curve (AUC) was measured from each viral growth curve and plotted as a bar graph. Data are mean ± SD (n = 3) and analyzed by two-way ANOVA with Dunnett’s multiple comparison test. (H-K) A549-ACE2 cells were uninfected or infected by Nsp15WT, Nsp15H234A, and Nsp15N277A rSARS-CoV-2 at MOI of 1 for 8 and 24 h. Total RNA collected for evaluating the host responses by RT-qPCR. Relative gene expression was normalized by 18S rRNA and presented relative to mock infection. Data are mean ± SD (n = 3) and analyzed by two-way ANOVA with Dunnett’s multiple comparison test. * P≤0.05; *** P≤0.001; **** P≤0.0001; ns, not significant.
Fig. 2
Fig. 2. Innate immune antagonism by Nsp15 during VSV infection.
(A) Design of rVSV-EGFP genome bearing SARS-CoV-2 Nsp15. (B) Vero cells were uninfected or infected by rVSV-EGFP expressing WT and H234A Nsp15 at MOI of 0.1 for 16 h. Western blot performed to verify the expression of indicated proteins. (C and D) Replication kinetics of parental rVSV-EGFP and rVSV-EGFP expressing WT and H234A Nsp15 in A549-ACE2 and A549-ACE2/STAT1 KO cells (MOI of 0.1). Data are mean ± SD (n = 3) and analyzed by two-way ANOVA with Dunnett’s multiple comparison test. (E-H) Total RNA collected from A549-ACE2 cells with rVSV-Nsp15WT and -Nsp15H234A infection and mock infection. RNA level of indicated host genes relative to 18S rRNA was measured by RT-qPCR and presented by fold change over mock infection. Data are mean ± SD (n = 3) and analyzed by two-way ANOVA. * P≤0.05; ** P≤0.01; *** P≤0.001.
Fig. 3
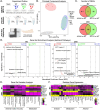
Fig. 3. The global transcriptional signatures from Nsp15 wild-type and mutant SARS-CoV-2 infected A549-ACE2 cells.
A549-ACE2 cells with mock, Nsp15WT, Nsp15H234A, and Nsp15N277A rSARS-CoV-2 infection for 8 and 24 h (MOI of 5). Total RNA with poly(A) enrichment followed by RNA sequencing analysis. (A) Schematic of bulk RNA-seq experimental design (n = 3 per group). (B) PCA of total normalized transcript abundance from mock, Nsp15 wild-type and mutant rSARS-CoV-2 infection. Sparse PCA depicts the global transcriptome of individual sample. (C) Venn diagram for unique and shared differentially expressed genes (Padj < 0.05 & |log2FC| > 1) in cells infected with Nsp15H234A and Nsp15N277A mutants compared to Nsp15WT virus. (D) Volcano plots showing GSEA results generated using MSigDB Hallmark pathways. (E) Cluster heatmap of GSVA scores generated using representative innate immune and metabolic signatures from MSigDB Gene Ontology signatures. (F) Expression heatmap of representative innate immune and metabolic genes in across mock, wild-type, and mutant rSARS-CoV-2 infection.
Fig. 4
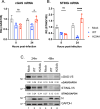
Fig. 4. Decrease in cGAS and STING during SARS-CoV-2 infection.
(A and B) Endogenous cGAS and STING mRNA levels in A549-ACE2 cells uninfected or infected with Nsp15WT and Nsp15H234A rSARS-CoV-2 at MOI of 5 for 8 or 24 h. RT-qPCR results are presented relative to the expression of 18S rRNA. Data are mean ± SD (n = 3) and analyzed by two-way ANOVA with Tukey’s multiple comparison test. * P≤0.05; **** P≤0.0001; ns, not significant. (C) BHK-ACE2 cells were mock infected or infected with Nsp15WT and Nsp15H234A rSARS-CoV-2 at MOI of 0.1, further transfected with cGAS and STING plasmids at 4 hpi. At 24 and 48 hpi, cell lysates were harvested for clarifying the indicated protein levels.
Fig. 5
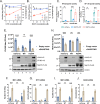
Fig. 5. Inhibition of host cGAS-STING pathway by Nsp15.
(A and B) A549-ACE2 cells were pretreated with H-151 or SN-011 for 16 h prior to viral infection. Cells were then infected with Nsp15WT (blue line) and Nsp15H234A (red line) rSARS-CoV-2 at MOI of 1 under H-151 or SN-011 treatment for 48 h. Supernatants harvested for viral titration by plaque assay. Cell viability determined by WST-1 assay after incubating with H-151 or SN-011 for 72 h (black dot line). Data are mean ± SD (n = 3). (C and D) HEK293T cells were co-transfected with IFN-β promoter reporter plasmid (C) or NF-κB responsive element reporter plasmid (D), Renilla control plasmid plus the indicated plasmids containing empty vector, cGAS/STING, mCherry and WT and H234A Nsp15 for 48 h. Relative luciferase activity was performed by use of Dual-Glo Luciferase System. Data are mean ± SD (n = 3) and analyzed by two-way ANOVA with Dunnett’s multiple comparison test. (E, F, G) HEK293T transfected with different combinations of plasmids were infected with EV-D68 at MOI of 0.1 for 48 h. Culture supernatants applied for viral titer quantification by plaque assay (E, upper bar graph). Cell lysates collected for protein level determination (E, lower blot graph) and total RNA collected for RT-qPCR (F, G). (H, I, J) HEK293T transfected with different combinations of plasmids were infected with NDV-EGFP at MOI of 1 for 48 h. Culture supernatants applied for viral titer quantification by focus forming assay targeting EGFP (H, upper bar graph). Cell lysates collected for protein level determination (H, lower blot graph) and total RNA collected for RT-qPCR (I, J). Relative target RNA level normalized with that of 18S rRNA or ACTB was shown. Data are mean ± SD (n = 3 or 4). and analyzed by two-way ANOVA with Šídák multiple comparison test. ** P≤0.01; *** P≤0.001; **** P≤0.0001; ns, not significant.
Fig. 6
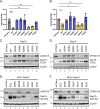
Fig. 6. Role of Nsp15 EndoU activity in cGAS and STING downregulation.
(A-D) HEK293T cells were transfected with cGAS or STING plasmid along with wild-type and mutant SARS-CoV-2 Nsp15 plasmids for 48 h. RNA levels (A and B) and protein levels (C and D) of cGAS and STING were measured by RT-qPCR and western blot, respectively. RT-qPCR results are presented relative to the expression of 18S rRNA. Data are mean ± SD (n = 3) and analyzed by one-way ANOVA with Dunnett’s multiple comparison test. (E and F) HEK293T cells were transfected with cGAS or STING plasmid plus mCherry or HCoV Nsp15 plasmids for 48 h. Western blot performed to assess the expression of indicated proteins.
Fig. 7
Fig. 7. Viral pathogenesis of Nsp15 EndoU inactive SARS-CoV-2 in hamsters.
Golden Syrian hamsters were intranasally inoculated with 1×10⁵ PFU of Nsp15WT or Nsp15H234A rSARS-CoV-2, or equivalent volume of PBS. (A) Viral pathogenicity was evaluated by body weight loss. (B-E) Viral titer in the nasal turbinates, lungs, olfactory bulbs, and brains were determined at 5 dpi by plaque assay. Data are mean ± SEM (n = 4) and analyzed by unpaired t-test. * P≤0.05; ** P≤0.01. (F-J) Host responses in lungs assessed by RT-qPCR. Data are mean ± SEM (n = 4).

Similar articles

References

    1. V’Kovski P., Kratzel A., Steiner S., Stalder H., Thiel V., Coronavirus biology and replication: implications for SARS-CoV-2. Nat Rev Microbiol 19, 155–170 (2021). - PMC - PubMed
    1. Salukhe I., Choi R., Van Voorhis W., Barrett L., Hyde J., Regulation of coronavirus nsp15 cleavage specificity by RNA structure. PLoS One 18, e0290675 (2023). - PMC - PubMed
    1. Hackbart M., Deng X., Baker S. C., Coronavirus endoribonuclease targets viral polyuridine sequences to evade activating host sensors. Proc Natl Acad Sci U S A 117, 8094–8103 (2020). - PMC - PubMed
    1. Ancar R. et al., Physiologic RNA targets and refined sequence specificity of coronavirus EndoU. RNA 26, 1976–1999 (2020). - PMC - PubMed
    1. Wang X., Zhu B., SARS-CoV-2 nsp15 preferentially degrades AU-rich dsRNA via its dsRNA nickase activity. Nucleic Acids Res 10.1093/nar/gkae290 (2024). - DOI - PMC - PubMed

Publication types