. 2024 Aug 22;10(17):e36650.
doi: 10.1016/j.heliyon.2024.e36650. eCollection 2024 Sep 15.

Network medicine based approach for identifying the type 2 diabetes, osteoarthritis and triple negative breast cancer interactome: Finding the hub of hub genes

Affiliations

Network medicine based approach for identifying the type 2 diabetes, osteoarthritis and triple negative breast cancer interactome: Finding the hub of hub genes

Ilhaam Ayaz Durrani et al. Heliyon. .

Abstract

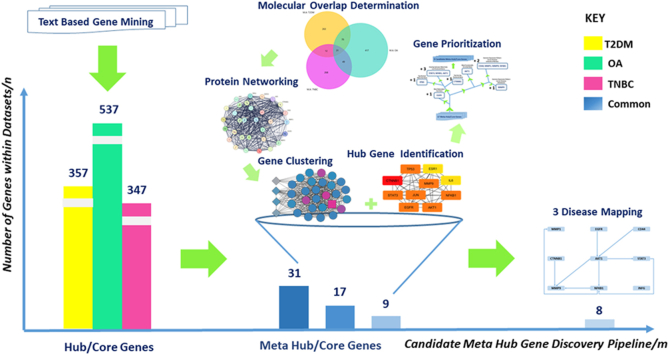
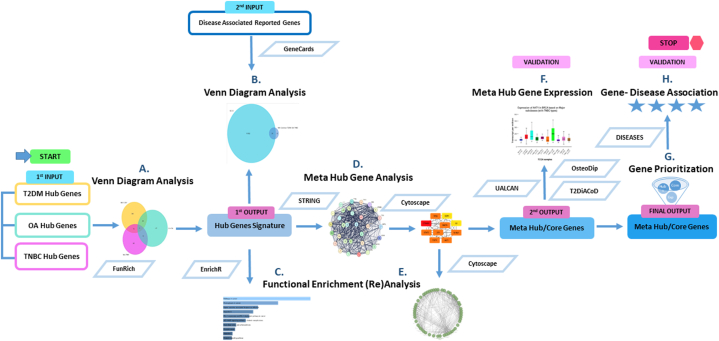
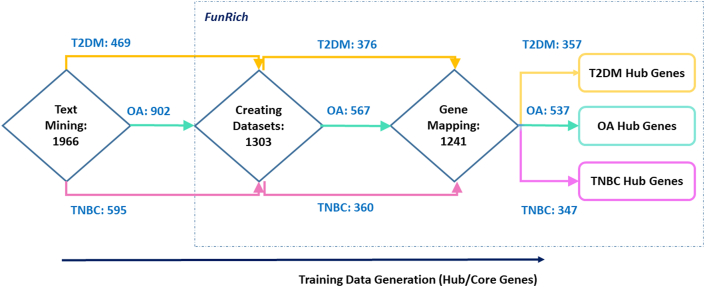
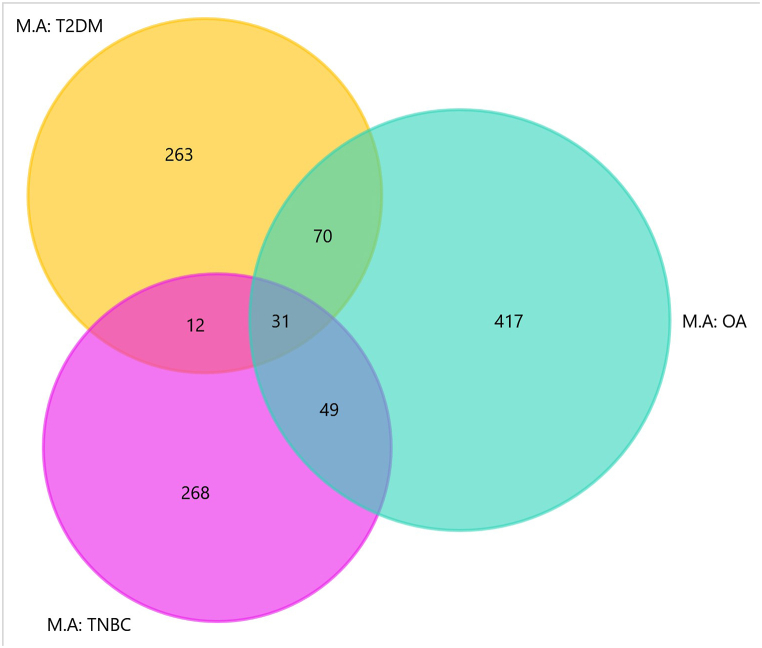
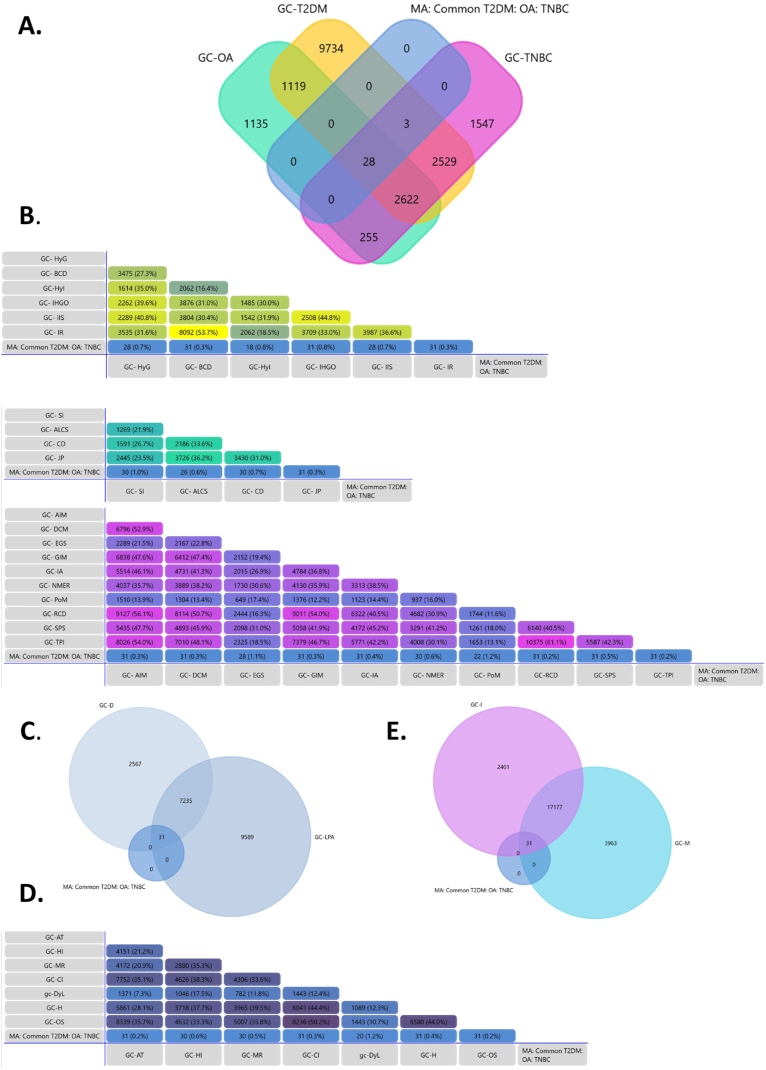
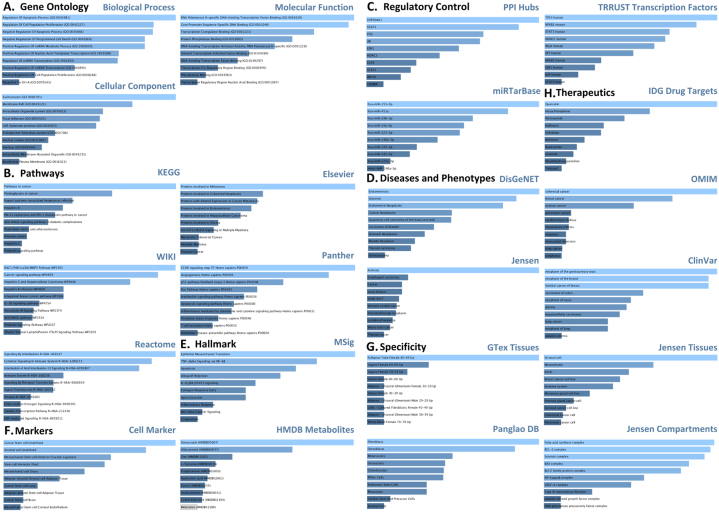
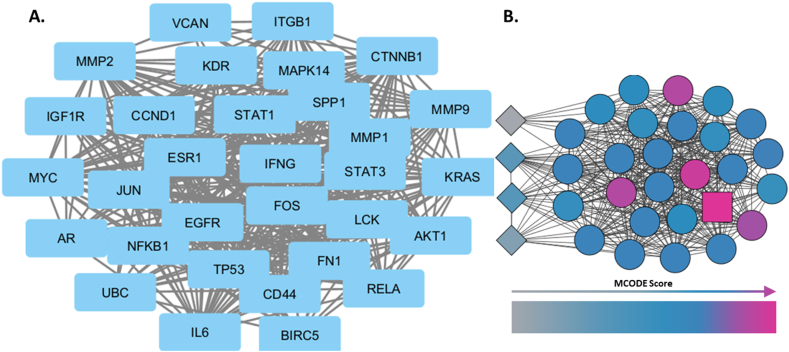
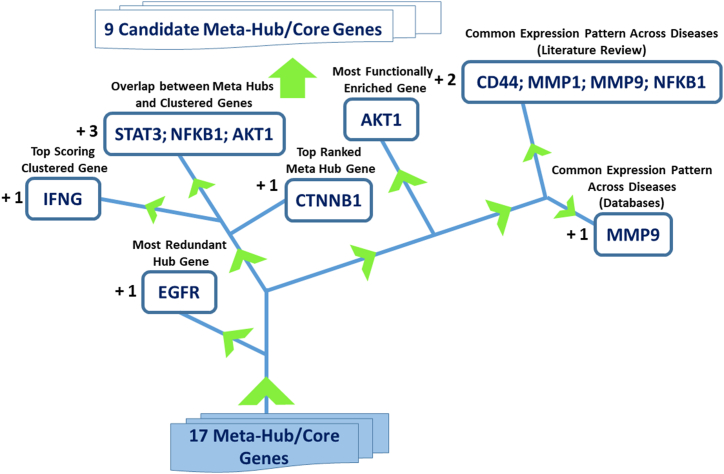
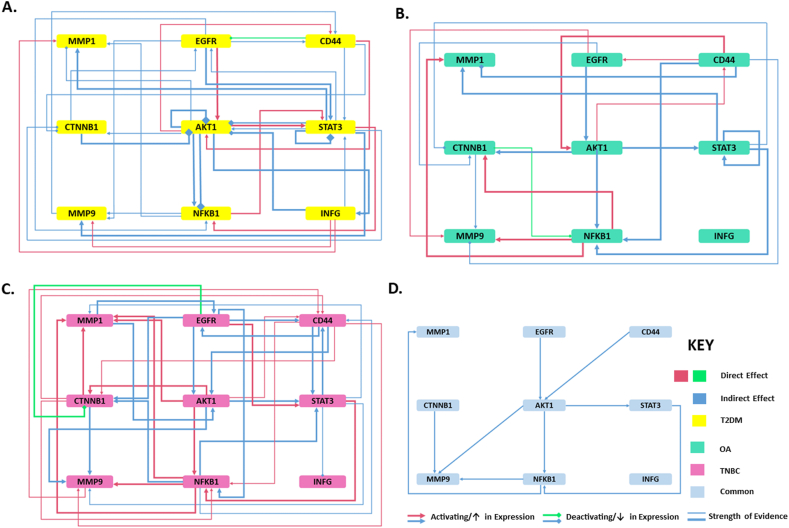
The increasing prevalence of multi-morbidities, particularly the incidence of breast cancer in diabetic/osteoarthritic patients emphasize on the need for exploring the underlying molecular mechanisms resulting in carcinogenesis. To address this, present study employed a systems biology approach to identify switch genes pivotal to the crosstalk between diseased states resulting in multi-morbid conditions. Hub genes previously reported for type 2 diabetes mellitus (T2DM), osteoarthritis (OA), and triple negative breast cancer (TNBC), were extracted from published literature and fed into an integrated bioinformatics analyses pipeline. Thirty-one hub genes common to all three diseases were identified. Functional enrichment analyses showed these were mainly enriched for immune and metabolism associated terms including advanced glycation end products (AGE) pathways, cancer pathways, particularly breast neoplasm, immune system signalling and adipose tissue. The T2DM-OA-TNBC interactome was subjected to protein-protein interaction network analyses to identify meta hub/clustered genes. These were prioritized and wired into a three disease signalling map presenting the enriched molecular crosstalk on T2DM-OA-TNBC axes to gain insight into the molecular mechanisms underlying disease-disease interactions. Deciphering the molecular bases for the intertwined metabolic and immune states may potentiate the discovery of biomarkers critical for identifying and targeting the immuno-metabolic origin of disease.

Keywords: Bioinformatics; Gene mining; Meta hub genes; Network analysis; Osteoarthritis; Switch genes; Triple negative breast cancer; Type 2 diabetes mellitus.


Conflict of interest statement

None Declared.

Figures

Image 1
Graphical abstract
Fig. 1
Fig. 1
Literature search and article selection. PubMed database was searched for articles on hub gene analysis for type 2 diabetes mellitus (T2DM), osteoarthritis (OA), and triple negative breast cancer (TNBC) in singularity and in combination. A total of 252 were henceforth utilized for subsequent disease specific hub/key genes mining.
Fig. 2
Fig. 2
Study methodology flow diagram. The disease specific hub/core genes were input into the candidate meta hub gene discovery pipeline to generate potential multi-morbidity associated biomarkers. Start and end point are indicated and input/output are referred to in terms of genes. The outlined rectangle boxes represent input, blue outlined rhombus-software/tool/database, light blue coloured box-critical outcome/secondary input, medium blue box-intermediary output and dark blue box-final output/outcome in terms of critical genes. (For interpretation of the references to colour in this figure legend, the reader is referred to the Web version of this article.)
Fig. 3
Fig. 3
Textminingandtrainingdatageneration. Hub/key/coregenesassociatingwith type 2 diabetes mellitus (T2DM)/osteoarthritis (OA)/triple negative breast cancer (TNBC)wereextractedfrompublishedliteratureandmappedontoFunRichsoftware.Statisticalfiguresindicatethenumberofgenesobtainedateachstep.
Fig. 4
Fig. 4
Venn diagram analysis. The yellow circle represents type 2 diabetes mellitus (T2DM) hub genes derived for meta hub gene analysis (M.A), sea green-osteoarthritis (OA) and pink-triple negative breast cancer (TNBC). The intersection between circles represent overlapping genes common to more than one disease. A total of 31 genes overlapped between all three datasets. (For interpretation of the references to colour in this figure legend, the reader is referred to the Web version of this article.)
Fig. 5
Fig. 5
Phenotype to gene mapping. Overlap of 31 hub genes signature with GeneCards derived genes for A- T2DM, OA and TNBC, B- Hallmarks for T2DM (top), OA (middle), and TNBC (bottom), C- Common factors, D- Common characteristics and E- Common pathways. Abbreviations: M.A-meta hub gene analysis; T2DM-type 2 diabetes mellitus; OA-osteoarthritis; TNBC- triple negative breast cancer; GC- Gene Cards; HyG-hyperglycemia; BCD-beta cell dysfunction; HyI- hyperinsulinemia; IHGO- increased hepatic glucose output; IIS- inadequate insulin secretion; IR-insulin resistance; SI- synovial inflammation; ALCS- asymmetric loss of cartilage space; CD-chondrocyte degradation; JP- joint pain; AIM-activating invasion and metastasis; DCM-deregulating cellular metabolism; EGS- evading growth suppressors; GIM-genome instability and mutation; IA-inducing angiogenesis; NMER-non mutational epigenetics reprogramming; PoM-polymorphic microbes; RCD-resisting cell death; SPS- sustaining proliferative signals; TPI- tumor promoting inflammation; AT-adipose tissue; HI-hormonal imbalance; MR-; CI- chronic inflammation; H-; OS- oxidative stress.
Fig. 6
Fig. 6
EnrichR based functional enrichment analysis.Enrichmentforvariouscategoriesaredepicted.A-Geneontologyincludingthreecategories,B-Pathways(fivesources),C-Regulation(threecategories),D-Diseasesandphenotypes(fourdatabases),E-Hallmark(onesource),F-Markers(twotypes),G.Specificity(fourcategories)andH-Therapeutics(basedon one database).
Fig. 7
Fig. 7
Cytoscape based network analysis. A-A.OriginalnetworkimportedfromSTRINGwithnodesrepresentedbylabelledbluerectanglesandedgesbygreylines.B- Cluster1derivedthroughapplicationofMCODEplugin,withnodesrepresentedbyrhombusasun-clustered,circleasclusteredandrectangleasseed.TheincreaseinnodecolourintensityrepresentsincreasingMCODEscore. (For interpretation of the references to colour in this figure legend, the reader is referred to the Web version of this article.)
Fig. 8
Fig. 8
Gene ontology and pathway reanalyses on Cytoscape. The nodes represent different terms, their colours correspond to functional groups and the edges between nodes indicate interaction and crosstalk. Nodes with multiple colours symbolize genes common between more than one term. A- Gene ontology (GO) biological processes, B- GO molecular function, C- GO cellular component and D- KEGG pathway. (For interpretation of the references to colour in this figure legend, the reader is referred to the Web version of this article.)
Fig. 9
Fig. 9
Disease specific meta hub gene expression. A- T2DiACoD database and GEO dataset GSE29231 generated expression data for type 2 diabetes mellitus (T2DM). The heat map depicts tissue specific expression for T2DM, p < 0.05, red: up-regulated; green: down-regulated, B- OsteoDip generated data expression for osteoarthritis (OA). The snapshot represents heat map generated for OA specific gene expression for meta hub genes based on 31 sources, red: up-regulated; green: down-regulated, C- UALCAN generated expression data for triple negative breast cancer (TNBC). The generated heat map for the meta hub genes show the expression pattern of each of the genes across TNBC and healthy control samples, D- TNBC subtype specific expression data for meta hub genes. BRCA: Breast invasive carcinoma. (For interpretation of the references to colour in this figure legend, the reader is referred to the Web version of this article.)
Fig. 10
Fig. 10
Gene prioritization. Various parameters were applied to shortlist 9 meta hub genes.
Fig. 11
Fig. 11
Wiring diagram representing disease signalling networks. Disease specific signalling maps are presented for A- Type 2 diabetes mellitus (T2DM) [36,37,[38], [39], [40], [41], [42], [43], [44], [45], [46], [47], [48], [49], [50], [51], [52], [53], [54], [55], [56], [57], [58], [59], [60], [61], [62]], B- Osteoarthritis (OA) [63,64,[65], [66], [67], [68], [69], [70], [71], [72], [73], [74], [75], [76], [77], [78], [79], [80], [81], [82], [83]], C- Triple negative breast cancer (TNBC) [84,85,86,87,88,[89], [90], [91], [92], [93], [94], [95], [96], [97], [98], [99], [100], [101], [102], [103], [104], [105], [106], [107], [108], [109], [110], [111], [112], [113], [114]], and D- 3 Disease mapping of T2DM-OA-TNBC signalling network.

Similar articles

References

    1. Grimaldi A.M., Conte F., Pane K., Fiscon G., Mirabelli P., Baselice S., Giannatiempo R., Messina F., Franzese M., Salvatore M., Paci P., Incoronato M. The new Paradigm of network medicine to analyze breast cancer phenotypes. Int. J. Mol. Sci. 2020;21:6690. doi: 10.3390/ijms21186690. - DOI - PMC - PubMed
    1. Feodoroff M., Harjutsalo V., Mäkimattila S., Groop P.-H. Incidence and risk factors for cancer in people with type 1 diabetes, stratified by stages of diabetic kidney disease: a nationwide Finnish cohort study. The Lancet Regional Health – Europe. 2024;40 doi: 10.1016/j.lanepe.2024.100884. - DOI - PMC - PubMed
    1. Shahid R.K., Ahmed S., Le D., Yadav S. Diabetes and cancer: risk, challenges, management and outcomes. Cancers. 2021;13:5735. doi: 10.3390/cancers13225735. - DOI - PMC - PubMed
    1. Piva S.R., Susko A.M., Khoja S.S., Josbeno D.A., Fitzgerald G.K., Toledo F.G.S. Links between osteoarthritis and diabetes:implications for management from a physical activity perspective. Clin. Geriatr. Med. 2015;31:67–87. doi: 10.1016/j.cger.2014.08.019. - DOI - PMC - PubMed
    1. Tian Z., Mclaughlin J., Verma A., Chinoy H., Heald A.H. The relationship between rheumatoid arthritis and diabetes mellitus: a systematic review and meta-analysis. Cardiovasc Endocrinol Metab. 2021;10:125–131. doi: 10.1097/XCE.0000000000000244. - DOI - PMC - PubMed

Further reading

    1. Desterke C., Xiang Y., Elhage R., Duruel C., Chang Y., Hamaï A. Ferroptosis inducers upregulate PD-L1 in recurrent triple-negative breast cancer. Cancers. 2024;16:155. doi: 10.3390/cancers16010155. - DOI - PMC - PubMed
    1. Rosshirt N., Hagmann S., Tripel E., Gotterbarm T., Kirsch J., Zeifang F., Lorenz H.‐M., Tretter T., Moradi B. A predominant Th1 polarization is present in synovial fluid of end‐stage osteoarthritic knee joints: analysis of peripheral blood, synovial fluid and synovial membrane. Clin. Exp. Immunol. 2019;195:395–406. doi: 10.1111/cei.13230. - DOI - PMC - PubMed
    1. Zhang F.-J., Luo W., Gao S.-G., Su D.-Z., Li Y.-S., Zeng C., Lei G.-H. Expression of CD44 in articular cartilage is associated with disease severity in knee osteoarthritis. Mod. Rheumatol. 2013;23:1186–1191. doi: 10.3109/s10165-012-0818-3. - DOI - PubMed
    1. Hopwood B., Tsykin A., Findlay D.M., Fazzalari N.L. Microarray gene expression profiling of osteoarthritic bone suggests altered bone remodelling, WNT and transforming growth factor-β/bone morphogenic protein signalling. Arthritis Res. Ther. 2007;9:R100. doi: 10.1186/ar2301. - DOI - PMC - PubMed
    1. Sliwinska A., Kasznicki J., Kosmalski M., Mikołajczyk M., Rogalska A., Przybylowska K., Majsterek I., Drzewoski J. Tumour protein 53 is linked with type 2 diabetes mellitus. Indian J. Med. Res. 2017;146:237–243. doi: 10.4103/ijmr.IJMR_1401_15. - DOI - PMC - PubMed

LinkOut - more resources