. 2024 Sep 14;43(1):262.
doi: 10.1186/s13046-024-03179-5.

In vivo CAR T cell therapy against angioimmunoblastic T cell lymphoma

Affiliations

In vivo CAR T cell therapy against angioimmunoblastic T cell lymphoma

Adrien Krug et al. J Exp Clin Cancer Res. .

Abstract

Background: For angioimmunoblastic T cell lymphoma (AITL), a rare cancer, no specific treatments are available and survival outcome is poor. We previously developed a murine model for AITL that mimics closely human disease and allows to evaluate new treatments. As in human AITL, the murine CD4+ follicular helper T (Tfh) cells are drivers of the malignancy. Therefore, chimeric antigen receptor (CAR) T cell therapy might represent a new therapeutic option.

Methods: To prevent fratricide among CAR T cells when delivering an CD4-specific CAR, we used a lentiviral vector (LV) encoding an anti-CD4 CAR, allowing exclusive entry into CD8 T cells.

Results: These anti-CD4CAR CD8-targeted LVs achieved in murine AITL biopsies high CAR-expression levels in CD8 T cells. Malignant CD4 Tfh cells were eliminated from the mAITL lymphoma, while the CAR + CD8 T cells expanded upon encounter with the CD4 receptor and were shaped into functional cytotoxic cells. Finally, in vivo injection of the CAR + CD8-LVs into our preclinical AITL mouse model carrying lymphomas, significantly prolonged mice survival. Moreover, the in vivo generated functional CAR + CD8 T cells efficiently reduced neoplastic T cell numbers in the mAITL tumors.

Conclusion: This is the first description of in vivo generated CAR T cells for therapy of a T cell lymphoma. The strategy described offers a new therapeutic concept for patients suffering from CD4-driven T cell lymphomas.

Keywords: AITL; CAR T; CD8-targeted virus envelope; Cancer therapy; In vivo gene therapy; Lentiviral vector; Preclinical model; Pseudotyping; T cell lymphoma.


Conflict of interest statement

E.V. and C.J.B are listed as inventors on patents on receptor-targeted LVs that have been licensed out. All other authors declare no competing interests.

Figures
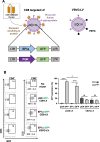
Fig. 1
Fig. 1
Specific transduction of CD8 + murine T lymphocytes by mCD8-LVs (A) Schematic representation of CD8-targeted lentiviral vectors (mCD8-LVs) or VSV-G pseudotyped LVs. CD8-LVs carry at their surface the measles virus fusion protein (F) and the receptor binding H protein fused to a DARPin, specific for mouse CD8. The two lentiviral vector constructs incorporated into these LVs are presented. SIN: self-inactivating; LTR: HIV long terminal repeat; EF1a: elongation factor 1 alpha promoter, PGK: PGK: phosphoglycerate kinase 1 promoter. B Transduction of murine splenic T cells after TCR-stimulation was performed with mCD8-LVs (10 ng p24 content) or VSV-G-LVs (2 ng p24 content) carrying the EF1a-GFP or the PGK-GFP expression cassettes Transduction was analyzed by FACS on day 3 post-transduction by gating on CD4 + T cell and CD8 + T cells and summarized in (C). Data are represented as mean (SD) (n = 3; biological replicates, multiple t-test, *p < 0.05; ***p < 0.001, ns = not significant)
Fig. 2
Fig. 2
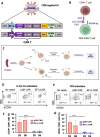
Anti-CD8-LVs show highest murine CD4-CAR expression when driven by the PGK promoter. A Schematic representation of the mCD8-LVs and the anti-mCD4 expressing CAR encoding vector constructs. LTR: HIV long terminal repeat; EF1a: Elongation factor 1 alpha promoter, PGK: phosphoglycerate kinase 1 promoter; mCD4scFv: single chain variable fragment of a murine anti-CD4 antibody; 4-1BB: T cell costimulatory domain; CD3ζ: CD3 signaling domain; T2A: peptide permitting co-expression of two proteins; hCD34: epitope recognized by an anti-human CD34 antibody. B Schematic representation of the CD8 + cells expressing the anti-CD4CAR binding to CD4 + T cells and co-expressing the hCD34 epitope to facilitate detection by FACS using an anti-hCD34 antibody. C Representation of the stimulation and transduction protocols for T cells isolated from WT spleens. Created with Biorender.com. T cells were activated either using anti-CD3 and anti-CD28 antibodies, or IL-7/IL-15 cytokine stimulation for 3 days. Then the T cells were transduced with the indicated vectors at equivalent numbers of viral particles (p24: 10 ng); Created with Biorender.com. At day 3 (D, E) and day 6 (F and G) post-transduction, cells were evaluated for hCD34 + expression by FACS analysis. Data are represented (mean (SD) (F) PGK-CAR d3 n = 6, d6 n = 3; EF1a-CAR d3 n = 4, d6 n = 3 and (G) PGK-CAR d3 n = 7, d6 n = 6; EF1a-CAR d3 n = 5, d6 n = 3; t-test; ***p < 0.001)
Fig. 3
Fig. 3
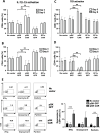
CD8-LVs mediated CD4-CAR expression by the PGKprom outperformed EF1aprom in CAR T cell activity. T cells were stimulated by IL-7/IL-15 or through the TCR and transduced as outlined in Fig. 2C with the indicated vectors at equivalent viral particle levels (10 ng p24). FACS analysis was performed on day 3 and 6 post-transduction to detect the % of CD8+ T cells (A,C) and CD4.+ T cells (B,D). (mean (SD); (A,B) No vector d3 n = 4, d6 n = 4; PGK-GFP d3 n = 5, d6 n = 3; PGK-CAR d3 n = 7, d6 n = 4; EF1a-GFP d3 n = 3, d6 n = 3; EF1a-CAR d3 n = 3, d6 n = 3 n = 4; **p < 0.01; (C,D), No vector d3 n = 7, d6 n = 6; PGK-GFP d3 n = 5, d6 n = 5; PGK-CAR d3 n = 7, d6 n = 4; EF1a-GFP d3 n = 3, d6 n = 3; EF1a-CAR d3 n = 3, d6 n = 3; **p < 0.01, ***p < 0.001; multiple t-test). (E) Six days post-transduction T cells were surface stained for CD8 followed by intracellular staining for IFNγ, perforin and granzyme B and analyzed by FACS. Representative FACS plots are shown and data are summarized in the histogram (mean ± SD, multiple t-test; no vector IFNγ n = 3, granzyme B n = 3, Perforin n = 3; pGK-GFP: IFNγ n = 4; granzyme B n = 4; perforin n = 3; pGK-CAR: IFNγ n = 5; granzyme B n = 4; perforin n = 3; **p < 0.01, ***p < 0.001)
Fig. 4
Fig. 4
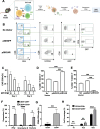
Anti-CD8-LVs encoding the CD4-CAR induced CD8 TIL expansion in murine AITL lymphoma biopsies and CD4 neoplastic T cell death. A Enlarged spleens from mice that developed AITL lymphoma (mAITL), were isolated and total tumor cells were put in culture in the presence of IL-7 and IL-15 as indicated in the workflow. Created by Biorender.com (B) FACS analysis was performed on day 3 to detect the % of hCD34 (mCD4CAR +) or GFP + expressing CD8 and CD4 T cells upon transduction with anti-CD4CAR- or GFP-encoding mCD8-LV respectively. Data are summarized as a histogram in (C) as mean (SD, n = 7). FACS analysis to determine the % of CD8 T cells (D) and CD4 T cells (E) 6 days post-transduction in the mAITL biopsies (mean (SD), No vector n = 3; PGK-CAR n = 8, PGK-GFP n = 3; one-way-Anova; ****p < 0.0001). F Six days post-transduction T cells were surface stained for CD8 and hCD34 followed by intracellular staining for INFγ, perforin and granzyme B and analyzed by FACS. Expression of these cytotoxic molecules are shown for CAR positive (hCD34 +) or negative (hCD34-) CD8 TILs. Data are summarized in the histogram (mean (SD), INFγ n = 6, Granzyme n = 6, Perforin n = 3; multiple student t-test; *p < 0.05, ***p < 0.001, ****p < 0.0001). G Three days post-transduction T cells were surface stained for CD8 and hCD34 followed by staining for CD69. The percentage of cells expressing CD69 activation marker is shown for CD8 TILs positive for the anti-CD4CAR (hCD34 +) or not (hCD34-) (mean (SD) n = 4, t-test,**p < 0.01). H Six days post-transduction T cells were surface stained for CD8 and hCD34 followed by staining for CD44 and CD62L. The percentage of naïve T cells (TN), central memory T cells (TCM) and effector memory is shown (TEM) (Mean (SD); n = 6, multiple t-test; ***p < 0.001,**p < 0.01)
Fig. 5
Fig. 5
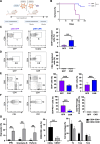
Anti-CD8-LVs encoding the antiCD4-CAR increased survival of the mAITL mice through elimination of neoplastic CD4 + PD1high T cells (A) Splenic lymphoma cells from mAITL mice were injected intravenously into recipient NSG mice (n = 24). Three months upon engraftment, mice were treated with CD8-LV encoding GFP (n = 10) or anti-CD4CAR CD8-LVs (n = 10) by IV injection. Created with Biorender.com. Survival curves for both mouse groups are shown in (B). Mice were sacrificed at humane endpoint or 200 days post-transplant (****p < 0.0001, Mantel-Cox test). C,D FACS analysis of the percentage GFP + CD8 + and GFP + CD4 + cells in the PGK-GFP group and hCD34 + CD8 + and hCD34 + CD4 + cells in the PGK-CAR group at sacrifice. Representative FACS plots are shown and data are summarized in the histogram (mean (SD); n = 8 for PGK-GFP CD8-LV, n = 8 for PGK-CAR CD8-LV;t-test **p < 0.01) (E) FACS analysis of the percentage CD4 + and CD8 + cells in the indicated treatment groups at sacrifice; a representative FACS plot is shown and data are summarized in the histogram (mean (SD); n = 8 for PGK-GFP CD8-LV, n = 8 for PGK-CAR CD8-LV; t-test, ***p < 0.001). F FACS analysis of percentage of CD4 + PD1high cells per total CD4 + T cells in the spleen and the percentage of GFP + and CD34 + CD4 + PD1.high cells of the indicated treatment groups at sacrifice; a representative FACS plot is shown and data are summarized in the histogram (mean (SD); n = 8 for PGK-GFP CD8-LV, n = 8 for PGK-CAR CD8-LV; t-test, ***p < 0.001). G At sacrifice splenic T cells were surface stained for CD8 and hCD34 followed by intracellular staining for INFγ, perforin and granzyme B and analyzed by FACS. Expression of these cytotoxic molecules are shown for CAR positive (hCD34 +) or negative (hCD34-) CD8 TILs. Data are summarized in the histogram (right panel, mean (SD), INFγ n = 5, Granzyme n = 5, Perforin n = 5; multiple student t-test; **p < 0.01). Further, T cells were surface stained for CD8 and hCD34 followed by staining for CD69. The percentage of cells expressing CD69 activation marker is shown for CD8 TILs positive for the anti-CD4CAR (hCD34 +) or not (hCD34-) (middle panel mean (SD) n = 5, t-test,**p < 0.01). T cells were surface stained for CD8 and hCD34, CD44 and CD62L. The percentage of naïve T cells (TN), central memory T cells (TCM) and effector memory is shown (TEM) (Mean (SD); n = 5, multiple t-test;*p < 0.05)

Similar articles

References

    1. Lachenal F, Berger F, Ghesquières H, Biron P, Hot A, Callet-Bauchu E, Chassagne C, Coiffier B, Durieu I, Rousset H, et al. Angioimmunoblastic T-cell lymphoma: clinical and laboratory features at diagnosis in 77 patients. Medicine (Baltimore). 2007;86:282–92. 10.1097/MD.0b013e3181573059. 10.1097/MD.0b013e3181573059 - DOI - PubMed
    1. de Leval L, Parrens M, Le Bras F, Jais J-P, Fataccioli V, Martin A, Lamant L, Delarue R, Berger F, Arbion F, et al. Angioimmunoblastic T-cell lymphoma is the most common T-cell lymphoma in two distinct French information data sets. Haematologica. 2015;100:e361-364. 10.3324/haematol.2015.126300. 10.3324/haematol.2015.126300 - DOI - PMC - PubMed
    1. Mourad N, Mounier N, Brière J, Raffoux E, Delmer A, Feller A, Meijer CJLM, Emile J-F, Bouabdallah R, Bosly A, et al. Clinical, biologic, and pathologic features in 157 patients with angioimmunoblastic T-cell lymphoma treated within the Groupe d’Etude des Lymphomes de l’Adulte (GELA) trials. Blood. 2008;111:4463–70. 10.1182/blood-2007-08-105759. 10.1182/blood-2007-08-105759 - DOI - PMC - PubMed
    1. Frizzera G, Moran EM, Rappaport H. Angio-immunoblastic lymphadenopathy. Diagnosis and clinical course. Am J Med. 1975;59:803–18. 10.1016/0002-9343(75)90466-0. 10.1016/0002-9343(75)90466-0 - DOI - PubMed
    1. Alizadeh AA, Advani RH. Evaluation and management of angioimmunoblastic T-cell lymphoma: a review of current approaches and future strategies. Clin Adv Hematol Oncol. 2008;6:899–909. - PubMed

MeSH terms

Substances

LinkOut - more resources