. 2024 Sep 13;15(1):8020.
doi: 10.1038/s41467-024-52346-x.

Spatial organization of translation and translational repression in two phases of germ granules

Affiliations

Spatial organization of translation and translational repression in two phases of germ granules

Anne Ramat et al. Nat Commun. .

Abstract

Most RNA-protein condensates are composed of heterogeneous immiscible phases. However, how this multiphase organization contributes to their biological functions remains largely unexplored. Drosophila germ granules, a class of RNA-protein condensates, are the site of mRNA storage and translational activation. Here, using super-resolution microscopy and single-molecule imaging approaches, we show that germ granules have a biphasic organization and that translation occurs in the outer phase and at the surface of the granules. The localization, directionality, and compaction of mRNAs within the granule depend on their translation status, translated mRNAs being enriched in the outer phase with their 5'end oriented towards the surface. Translation is strongly reduced when germ granule biphasic organization is lost. These findings reveal the intimate links between the architecture of RNA-protein condensates and the organization of their different functions, highlighting the functional compartmentalization of these condensates.


Conflict of interest statement

The authors declare no competing interests.

Figures
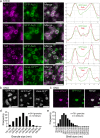
Fig. 1
Fig. 1. Drosophila germ granules have a biphasic organization.
a STED imaging of germ granule main components. Immunostaining of UASp-GFP-Aub; nos-Gal4 or vasa-GFPKI embryos with anti-Aub (magenta), anti-Osk (magenta), anti-Tud (magenta), and anti-GFP (green) to visualize GFP-Aub or Vasa-GFP. Fluorescence intensity (right) was measured along the path marked with a white dashed line and intensity profiles of each channel are shown on the graph. b 3D-OMX imaging of UASp-GFP-Aub; nos-Gal4 (left), GFP-TudKI (middle), Vasa-GFPKI (right) in which GFP was directly recorded without antibody staining. c 3D-OMX imaging of UASp-GFP-Aub/ vasa-tdTomKI; nos-Gal4/+ embryos in which GFP and tdTomato were directly recorded without antibody staining. d, e Measurement of germ granule size (d) and outer phase size (e) from wild-type embryos immunostained with Osk antibody and imaged using STED microscopy. Scale bars: 1 µm. Source data are provided as a Source Data file.
Fig. 2
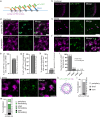
Fig. 2. Visualization of nos mRNA translation at germ granules using Suntag.
a Principle of the Suntag technique to visualize nos mRNA translation. Blue lines: nos mRNA (light blue: UTRs, dark blue: CDS). Purple line: Suntag array. The polysomes are in grey. The Suntag and Nos nascent peptides are in orange and blue, respectively. The scFv-GFP antibody (green) binds the Suntag peptide. suntag smFISH probes are in purple. Created on Biorender.com. b Confocal images of vasa-tdTomKI/nos-suntag-nos; nos-scFv-GFP/+ embryos. Vasa-tdTomato (magenta) and scFv-GFP (green) fluorescence were directly recorded without antibody staining. c STED images of immuno-smFISH of nos-suntag-nos/+; nos-scFv-GFP/+ embryos with anti-GFP nanobody (green) to detect scFv-GFP and suntag smFISH probes (magenta). d Fluorescent confocal images of vasa-tdTomKI/nos-suntag-nos; nos-scFv-GFP/+ permeabilized embryos without (top) and with puromycin treatment (bottom). Vasa-tdTomato (magenta) and scFv-GFP (green) fluorescence were directly recorded. e Percentage of scFv-GFP foci colocalizing with suntag-nos mRNA from images as in (c). f Close-up view of fluorescent confocal images of vasa-tdTomKI/nos-suntag-nos; nos-scFv-GFP/+ embryos showing scFv foci with germ granules. Vasa-tdTomato (magenta) and scFv-GFP (green) fluorescence were directly recorded. g Percentage of scFv-GFP foci colocalizing with germ granules marked with Vasa-tdTom from images as in (f). h Percentage of germ granules marked with Vasa-tdTom colocalizing with scFv-GFP foci, i.e., undergoing translation, from images as in (f). i Quantification of the number of scFv-GFP foci per granule from images as in (f). j STED imaging of nos-suntag-nos/+; nos-scFv-GFP/+ embryos immunostained with anti-Osk antibody (magenta) and anti-GFP nanobody (green) to reveal scFv-GFP. k, l Quantification of svFv-GFP foci localization within the germ granule biphasic structure from STED images as in (j). Radar plot of the relative distance of scFv-GFP foci (green dots) within Osk immunostaining (magenta). The granule shell is in pink (k). Percentage of scFv-GFP foci localized in the core (black), in and at the surface of the shell (grey), and at the immediate granule periphery (white) (l). m Percentage of suntag-nos mRNA foci localized in the core (black), in and at the surface of the shell (grey), and at the immediate granule periphery (white). The green dashed part in each category represents the proportion of suntag-nos foci undergoing translation (i.e., colocalizing with scFv-GFP) from images as in Supplementary Fig. 3e, f. Scale bars: 5 µm in (b), 1 µm in (ce, j). Source data are provided as a Source Data file. a Created with BioRender.com released under a Creative Commons Attribution-NonCommercial-NoDerivs 4.0 International license.
Fig. 3
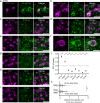
Fig. 3. Localization of translation initiation factors and translational repressors in the germ plasm.
a, b Localization of translation initiation factors. STED imaging of immunostaining of UASp-GFP-Aub/UASp-HA-eIF3d; nos-Gal4/+ (a) and UASp-GFP-Aub; nos-Gal4 (b) embryos with anti-GFP (magenta) to detect Aub, anti-HA (green) to detect eIF3d (a) and anti-PABP (green) (b). ci Localization of translational repressors. STED imaging of immunostaining of UASp-GFP-Aub; nos-Gal4, GFP-belle, and wild-type embryos with antibodies to reveal the indicated proteins. Germ granule markers are in magenta and translational repressors are in green. A larger germ granule exemplifying those present at later stages in primordial germ cells (PGC) is shown in (f). j Quantification of colocalization of GFP-Aub or Osk with the indicated proteins using PCC(Costes) from images as in (ae and gi). Black circles represent the mean and error bars represent SEM. The number of embryos is indicated (n). k Quantification of the distance between Smaug (Smg) foci and the edge of germ granules marked with GFP-Aub from images as in (c). Vertical bars represent the mean and SD. **p < 0.01 using χ2 test. p = 0.0033. Scale bars: 1 µm. Source data are provided as a Source Data file.
Fig. 4
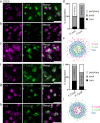
Fig. 4. mRNA localization within germ granules.
ad STED images of immuno-smFISH of wild-type embryos (20–120 min) with anti-Osk (magenta) and smFISH probes (green) against nos (a), gcl (b), pgc (c), and CycB (d) mRNAs. eh Percentage of localization of nos, gcl, pgc, and CycB mRNA foci in early (0–20 min) and late (20–90 min) wild-type embryos, in the core (black), in and at the surface of the shell (grey) and at the immediate periphery (white) of germ granules from images as in (ad). ns: non-significant, ****p < 0.0001 using the χ2 test. p = 0.61 in (e), 1.49 × 10−18 in (f), 0.26 in (g) and 0.17 in (h). e’h’, Radar plots of the relative localization of nos, gcl, pgc, and CycB mRNAs (green dots) within Osk immunostaining (magenta) in early (0–20 min) and late (20–90 min) embryos from images as in (ad). The granule shell is in pink. Scale bars: 1 µm. Source data are provided as a Source Data file.
Fig. 5
Fig. 5. mRNA orientation within germ granules.
a STED images of smFISH of wild-type embryos with nos 5′end (5-nos, magenta) and 3′end (3-nos, green) probes. b, c STED images of immuno-smFISH with anti-Osk antibody (magenta) as a marker of germ granules and nos 5′end (b) or 3′end (c) probes (green). d Percentage of nos 5′end and 3′end foci localized in the core (black), in and at the surface of the shell (grey), and at the immediate periphery (white) of germ granules from images as in (b, c). e Radar plot of the relative localization of nos 5′end (magenta dots) and 3′end (green dots) within Osk immunostaining (blue) in wild-type embryos from images as in (b, c). The granule shell is in blue. f STED images of smFISH of wild-type embryos with CycB 5′end (5-CycB, magenta) and 3′end (3-CycB, green) probes. g, h, STED images of immuno-smFISH with anti-Osk antibody (magenta) as a marker of germ granules and CycB 5′end (g) or 3′end (h) probes (green). i Percentage of CycB 5′end and 3′end foci localized in the core (black), in and at the surface of the shell (grey), and at the immediate periphery (white) of germ granules from images as in (g, h). j Radar plot of the relative localization of CycB 5′end (magenta dots) and 3′end (green dots) within Osk immunostaining (blue) in wild-type embryos from images as in (g, h). The granule shell is in blue. Scale bars: 1 µm. Source data are provided as a Source Data file.
Fig. 6
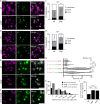
Fig. 6. mRNA localization and compaction within germ granules depend on their translation.
a, b STED imaging of immuno-smFISH of wild-type (top) and png1058 (bottom) embryos with anti-Osk antibody (magenta) as a marker of germ granule and smFISH probes (green) against nos (a) and gcl (b) mRNAs. c, d Percentage of localization of nos (c) and gcl (d) mRNA foci in wild-type and png1058 mutant embryos, in the core (black), in and at the surface of the shell (grey), and at the immediate periphery (white) of germ granules from images as in (a, b). **p < 0.01, ****p < 0.0001 using the χ2 test. p = 0.0031 in (c) and 1.75 × 10−22 in (d). e STED images of smFISH against nos 5′end (5-nos, magenta) and 3′end (3-nos, green) in wild-type and png1058 mutant embryos. f STED images of smFISH against nos 5′end (5-nos, magenta) and 3′end (3-nos, green) in wild-type stage 14 oocytes. g Violin plots showing distance distribution of colocalizing foci (5-nos to 5-nos and 3-nos to 3′-nos) and 5′end to 3′end distances for nos mRNAs at germ granules in wild-type and png1058 mutant embryos, from STED images as in (e). Dashed lines inside the violin plots show first quartile, median, and third quartile. Median distances are indicated on the right. ns: non-significant, ****p < 0.0001 using unpaired two-tailed Student’s t-test. p = 0.2 between 5′-nos/5′-nos and 3-nos/3-nos, p = 3.5 × 10−191 between 5-nos/5-nos and 5′-nos/3-nos in wt, p = 1.3 × 10−218 between 3′-nos/3′-nos and 5-nos/3-nos in wt and p = 4.5 × 10−58 between 5-nos/3-nos in wt and png−/−. The number of measured distances is indicated (n). h Measurement of the distance between nos 5′end foci and the edge of nos 3′end foci in wild-type embryos, png1058 embryos, and wild-type stage 14 oocytes (st14), from images as in (e, f). The histogram shows the percentage of nos 5′end foci in each distance class. i Percentage of nos 5′end foci overlaps with nos 3′end foci in wild-type embryos, png1058 embryos and wild-type stage 14 oocytes (st14). ns: non-significant, ****p < 0.0001 using the χ2 test. p = 2.64 × 10−129 between wt and png−/−, p = 1.79 × 10−167 between wt embryos and stage 14 oocytes, and p = 0.15 between png−/− embryos and stage 14 oocytes. Scale bars: 1 µm. Source data are provided as a Source Data file.
Fig. 7
Fig. 7. nos mRNA translation depends on germ granule biphasic architecture.
a STED images of wild-type and tudA36/Df(2R)PurP133 (tudA36) embryos immunostained with anti-Osk antibody. Fluorescence intensity was recorded along the white dotted line (right). b Measurement of germ granule size in wild-type and tudA36/Df(2R)PurP133 (tudA36) embryos from images as in (a). Horizontal bars represent the mean and SD. ****p < 0.0001 using unpaired two-tailed Student’s t-test. p = 2.4 × 10−248. c Immuno-smFISH of nos-suntag-nos/+; nos-scFv-GFP/+ (wild-type) and nos-suntag-nos tudA36/Df(2R)PurP133; nos-scFv-GFP/+ (tudA36) embryos with anti-GFP nanobody (green) to reveal scFv-GFP and suntag smFISH probe (magenta). d Percentage of suntag-nos mRNA clusters colocalizing with scFv-GFP foci, i.e., undergoing translation, in nos-suntag-nos/+; nos-scFv-GFP/+ (wild-type) and nos-suntag-nos tudA36/Df(2R)PurP133; nos-scFv-GFP/+ (tudA36) embryos from images as in (c). ****p < 0.0001 using χ2 test. p = 2 × 10−77. e STED images of immunostaining of nos-suntag-nos/+; nos-scFv-GFP/+ (wild-type) and nos-suntag-nos tudA36/Df(2R)PurP133; nos-scFv-GFP/+ (tudA36) embryos with anti-Osk antibody (magenta) and anti-GFP nanobody (green) to reveal scFv-GFP. f STED images of immunostaining of wild-type and tudA36/Df(2R)PurP133 (tudA36) embryos with anti-Osk (green) and anti-Aub (magenta) antibodies. g Quantification of colocalization between Osk and Aub using PCC(Costes). Black circles represent the mean and error bars represent SEM. The number of embryos is indicated (n). ns: non-significant using unpaired two-tailed Student’s t-test. p = 0.42. h STED images of immunostaining of wild-type and tudA36/Df(2R)PurP133 (tudA36) stage 14 oocytes with anti-Osk antibody. i Measurement of germ granule size in wild-type and tudA36/Df(2R)PurP133 (tudA36) stage 14 oocytes from images as in (h). Horizontal bars represent the mean and SD. ****p < 0.0001 using unpaired two-tailed Student’s t-test. p = 6.2 × 10−209. j Model of functional compartmentalization of germ granules. The scheme represents a biphasic germ granule with main protein components accumulating in the outer phase (green). Repressed mRNAs in a condensed state accumulate towards the granule core. Translation takes place in the outer phase and at the periphery of the granule. Translational activators (eIF3 and PABP) are found in the outer phase. Translated mRNAs are less condensed and anchored to the granule core from their 3′region, whereas their 5′end is oriented toward the outer phase and periphery of the granule. mRNAs translocate from the core to the outer phase during translation. Scale bars: 1 µm. Source data are provided as a Source Data file.

Similar articles

Cited by

References

    1. Banani, S. F., Lee, H. O., Hyman, A. A. & Rosen, M. K. Biomolecular condensates: organizers of cellular biochemistry. Nat. Rev. Mol. Cell Biol.18, 285–298 (2017). 10.1038/nrm.2017.7 - DOI - PMC - PubMed
    1. Boeynaems, S. et al. Protein phase separation: a new phase in cell biology. Trends Cell Biol.28, 420–435 (2018). 10.1016/j.tcb.2018.02.004 - DOI - PMC - PubMed
    1. Hirose, T., Ninomiya, K., Nakagawa, S. & Yamazaki, T. A guide to membraneless organelles and their various roles in gene regulation. Nat. Rev. Mol. Cell Biol.24, 288–304 (2023). 10.1038/s41580-022-00558-8 - DOI - PubMed
    1. Putnam, A., Thomas, L. & Seydoux, G. RNA granules: functional compartments or incidental condensates? Genes Dev.37, 354–376 (2023). 10.1101/gad.350518.123 - DOI - PMC - PubMed
    1. Mittag, T. & Pappu, R. V. A conceptual framework for understanding phase separation and addressing open questions and challenges. Mol. Cell82, 2201–2214 (2022). 10.1016/j.molcel.2022.05.018 - DOI - PMC - PubMed

MeSH terms

LinkOut - more resources