. 2024 Sep 14;15(9):672.
doi: 10.1038/s41419-024-07027-4.

Single-cell sequencing analysis of multiple myeloma heterogeneity and identification of new theranostic targets

Affiliations

Single-cell sequencing analysis of multiple myeloma heterogeneity and identification of new theranostic targets

Yanpeng Wang et al. Cell Death Dis. .

Abstract

Multiple myeloma (MM) is a heterogeneous and incurable tumor characterized by the malignant proliferation of plasma cells. It is necessary to clarify the heterogeneity of MM and identify new theranostic targets. We constructed a single-cell transcriptome profile of 48,293 bone marrow cells from MM patients and health donors (HDs) annotated with 7 continuous B lymphocyte lineages. Through CellChat, we discovered that the communication among B lymphocyte lineages between MM and HDs was disrupted, and unique signaling molecules were observed. Through pseudotime analysis, it was found that the differences between MM and HDs were mainly reflected in plasma cells. These differences are primarily related to various biological processes involving mitochondria. Then, we identified the key subpopulation associated with the malignant proliferation of plasma cells. This group of cells exhibited strong proliferation ability, high CNV scores, high expression of frequently mutated genes, and strong glucose metabolic activity. Furthermore, we demonstrated the therapeutic potential of WNK1 as a target. Our study provides new insights into the development of B cells and the heterogeneity of plasma cells in MM and suggests that WNK1 is a potential therapeutic target for MM.


Conflict of interest statement

The authors declare no competing interests.

Figures
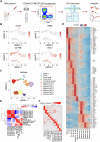
Fig. 1
Fig. 1. Construction of the B lymphocyte lineage expression profile of MM patients.
A Workflow. Bone marrow samples from 7 patients with multiple myeloma were selected for scRNA-seq. CD34+/CD19+/CD138+ cells enriched by MACS were further sorted and detected using flow cytometry. Cells were analyzed using the 10× Genomics Chromium scRNA-seq platform. B Expression of four characteristic marker genes (CD34, MME, CD79B, and SDC1) during B-cell development. C Unified manifold approximation and projection (UMAP) representation of single-cell gene expression, showing the 12 identified cell types. Cells were color-coded based solely on cluster annotation. D Expression heatmap of characteristic marker molecules for each cell subset. E Correlation analysis map of each cell subset. F BP enrichment results of characteristic expressed genes for each cell subset.
Fig. 2
Fig. 2. Cellular communication between cell clusters.
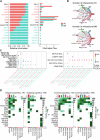
A The communication signals differed between HDs and MM patients. The left panel shows the proportions of various signaling molecules in HDs and MM patients, while the right panel shows the levels of different signaling molecules detected in HDs and MM patients. B Differences in signal molecule pairs between HDs and MM patients. C Differences in molecule pairs involved in plasma cell input and output signaling between HDs and MM patients. D Differences in the input and output signals between the HDs and MM patients. On the left side, the figure displays the expression of output signaling molecules in each cell cluster of HDs versus MM patients, while the right side illustrates the expression of input signaling molecules in each cell cluster of HD patients versus MM patients.
Fig. 3
Fig. 3. The developmental trajectory of B cells in MM.
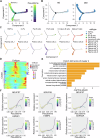
A Pseudotemporal analysis scores of expression profiles. B Pseudotemporal analysis of divergence trajectories between HDs and MM patients. C Pseudotemporal analysis of the divergent trajectories of each subgroup. D Heatmap showing gene enrichment on the two branches after the bifurcation point. E Results of Gene Ontology Biological Process (GO-BP) analysis of differences in Cluster 2. F Expression of the mitochondria-related genes NDUSF2, NDUSF5, and NDUDF7; the cycle-related gene CDKN2A; the autophagy-related gene HMGB1; and the lipid metabolism-related gene FABP5 according to the differentiation trajectory of the expression profile.
Fig. 4
Fig. 4. Heterogeneity analysis of plasma cells.
A UMAP plot illustrating the distribution of plasma cell subsets in HDs, NDMMs, and RPMMs. B The proportion of each plasma cell subset in HDs, NDMMs, and RPMMs. C The heterogeneity of cell cycle proliferation and division ability in each plasma cell subset. D Heterogeneity of glucose metabolism capacity in plasma cell subsets. E Expression of characteristic CD molecules in plasma cell subsets. F Survival curves of MM patients and correlation analysis of kinases and MM patients prognosis.
Fig. 5
Fig. 5. Biological effects of WNK1 on MM cells.
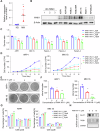
A Expression levels of WNK1 in the remaining bone marrow samples from normal donors and MM patients were determined using qRT-PCR. B The expression levels of WNK1 in the remaining bone marrow samples from normal donors and MM cell lines were detected using Western blot analysis. C Cell viability analysis of MM cell lines and bone marrow samples from MM patients. D Growth curves of MM cell lines treated with WNK-IN-11. E Colony formation experiments were conducted on MM cell lines treated with WNK-IN-11. F Statistics of clone numbers of MM cell lines. G Effect of WNK-IN-11 on the cell cycle distribution of MM cell lines, as determined by flow cytometry. H GLUT1 expression on the membrane surface was determined. GAPDH was used as the internal reference for plasma proteins, and ITGB1 was used as the internal reference for membrane proteins. Statistical analyses of n = 3 independent experiments were assessed. *p < 0.05, **p < 0.01, ***p < 0.001.
Fig. 6
Fig. 6. WNK-IN-11 has anti-MM effects in vivo.
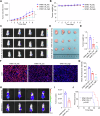
A Tumor volume change curve. B The body weights of the mice remained stable. C Fluorescence imaging results of subcutaneous tumors. D Tumor growth differences between groups. E Statistical analysis of the tumor weight data. F Ki67 immunohistochemical staining of tumors from each group was performed. G Statistical analysis of fluorescence intensity data. H Fluorescence imaging showing tumor development after tail vein injection. I Statistical analysis of the fluorescence intensity. J Survival curve of the mice. WNK-IN-low is a low-dose group with a concentration of 1 mg/kg. WNK-IN-high is a low-dose group with a concentration of 5 mg/kg. *p < 0.05, **p < 0.01, ***p < 0.001.

Similar articles

References

    1. Giaquinto AN, Miller KD, Tossas KY, Winn RA, Jemal A, Siegel RL. Cancer statistics for African American/Black People 2022. CA Cancer J Clin. 2022;72:202–29. 10.3322/caac.21718 - DOI - PubMed
    1. Cowan AJ, Green DJ, Kwok M, Lee S, Coffey DG, Holmberg LA, et al. Diagnosis and management of multiple myeloma: a review. J Am Med Assoc. 2022;327:464–77.10.1001/jama.2022.0003 - DOI - PubMed
    1. van de Donk N, Pawlyn C, Yong KL. Multiple myeloma. Lancet. 2021;397:410–27. 10.1016/S0140-6736(21)00135-5 - DOI - PubMed
    1. Callander NS, Baljevic M, Adekola K, Anderson LD, Campagnaro E, Castillo JJ, et al. NCCN Guidelines® Insights: Multiple Myeloma, Version 3.2022. J Natl Compr Canc Netw. 2022;20:8–19. 10.6004/jnccn.2022.0002 - DOI - PubMed
    1. Silberstein J, Tuchman S, Grant SJ. What is multiple myeloma? J Am Med Assoc. 2022;327:497.10.1001/jama.2021.25306 - DOI - PubMed

LinkOut - more resources