. 2024 Sep 12:13:RP95412.
doi: 10.7554/eLife.95412.

Altered firing output of VIP interneurons and early dysfunctions in CA1 hippocampal circuits in the 3xTg mouse model of Alzheimer's disease

Affiliations

Altered firing output of VIP interneurons and early dysfunctions in CA1 hippocampal circuits in the 3xTg mouse model of Alzheimer's disease

Felix Michaud et al. Elife. .

Abstract

Alzheimer's disease (AD) leads to progressive memory decline, and alterations in hippocampal function are among the earliest pathological features observed in human and animal studies. GABAergic interneurons (INs) within the hippocampus coordinate network activity, among which type 3 interneuron-specific (I-S3) cells expressing vasoactive intestinal polypeptide and calretinin play a crucial role. These cells provide primarily disinhibition to principal excitatory cells (PCs) in the hippocampal CA1 region, regulating incoming inputs and memory formation. However, it remains unclear whether AD pathology induces changes in the activity of I-S3 cells, impacting the hippocampal network motifs. Here, using young adult 3xTg-AD mice, we found that while the density and morphology of I-S3 cells remain unaffected, there were significant changes in their firing output. Specifically, I-S3 cells displayed elongated action potentials and decreased firing rates, which was associated with a reduced inhibition of CA1 INs and their higher recruitment during spatial decision-making and object exploration tasks. Furthermore, the activation of CA1 PCs was also impacted, signifying early disruptions in CA1 network functionality. These findings suggest that altered firing patterns of I-S3 cells might initiate early-stage dysfunction in hippocampal CA1 circuits, potentially influencing the progression of AD pathology.

Keywords: Alzheimer's disease; circuit; disinhibition; hippocampus; inhibition; memory; mouse; neuroscience.


Conflict of interest statement

FM, RF, DT, PI, ST, FC, LT No competing interests declared

Figures
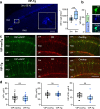
Figure 1.
Figure 1.. VIP/CR I-S3 cells survive but accumulate intracellular amyloid-β (Aβ) and its precursors in VIP-Tg mice.
(a) Confocal image of the CA1 hippocampal area showing intracellular accumulation of amyloid precursor protein (APP)/Aβ (6E10) in cell bodies of the pyramidal layer in a 3-month-old VIP-Tg mouse (left, scale bar: 100 μm; inset shows the area indicated with a white box) and summary box plot showing the density of cells expressing APP/Aβ intracellularly in 3- vs. 6-month-old mice (right; n = 8 slices from 3 animals per group). (b) Summary bar graphs showing the average number of VIP+ cells expressing APP/Aβ intracellularly per slice (left), and representative confocal images of the VIP-IN labeled with eGFP and showing intracellular accumulation of APP/Aβ in a 6-month-old VIP-Tg mouse (right). Scale bar: 10 μm (c) Representative confocal images of the CA1 hippocampal area in VIP-nonTg (top) and VIP-Tg (bottom) mice showing eGFP expression in VIP INs (left), CR expression (middle), and an overlay of both markers (right). Scale bar: 100 μm. (d) Summary plots showing no changes in the number of VIP-INs (left; VIP-nonTg: n = 17 slices/3 animals; VIP-Tg: n = 13 slices/3 animals), CR-INs (middle; VIP-nonTg: n = 11 slices/3 animals; VIP-Tg: n = 11 slices/3 animals), and VIP/CR co-expressing I-S3 cells (right; VIP-nonTg: n = 11 slices/3 animals, VIP-Tg: n = 11 slices/3 animals) in VIP-Tg mice.
Figure 1—figure supplement 1.
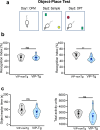
Figure 1—figure supplement 1.. Early deficits in the object-place test (OPT) of VIP-Tg mice.
(a) Schematic for the OPT: day 1 – open field maze (OFM) exploration; day 2 – sampling of two different objects; day 3 – OPT, in which one of the objects has been replaced by a new one and the second was displaced. In this test, mice show preference for a novel object (Francavilla et al., 2020). (b) Summary plots showing the recognition index (RI) on day 2 (left) and on day 3 (right) for VIP-nonTg and VIP-Tg mice. **p < 0.01 (VIP-nonTg: n = 10 animals; VIP-Tg: n = 11 animals). (c) Summary plots showing the total object exploration time on day 3 (left) and the total horizontal activity (right) for VIP-nonTg and VIP-Tg mice (VIP-nonTg: n = 10 animals; VIP-Tg: n = 11 animals). Note a significant decrease of RI in VIP-Tg mice despite unaltered activity and total exploration time.
Figure 2.
Figure 2.. Cells exhibit wider spikes and lower firing rate in VIP-Tg mice.
(a) Representative voltage responses (top, middle) showing the firing pattern of I-S3 cells in VIP-nonTg (left, black) and VIP-Tg (right, blue) mice in response to depolarizing and hyperpolarizing current injections (bottom). (b) Representative voltage traces in VIP-nonTg (black) and VIP-Tg (blue) mice superimposed for the first (top) and last (bottom) AP showing the longer AP duration in VIP-Tg mice. (c) Summary plots showing the amplitude (left), half-width (middle left), depolarization rate (middle), repolarization rate (middle right), and area (right) of the first AP in I-S3 cells. *p < 0.05 (VIP-nonTg: n = 8 cells/5 mice; VIP-Tg: n = 10 cells/3 mice). (d) Summary plots showing changes in the AP amplitude (left), half-width (middle), and area (right) during the train of APs in I-S3 cells. ****p < 0.0001 (VIP-nonTg: n = 7 cells/5 mice; VIP-Tg: n = 7 cells/3 mice). (e) Summary plots showing no changes in the AP depolarization rate (left) but slower repolarization rate (right) during the train of APs in I-S3 cells. ****p < 0.0001 (VIP-nonTg: n = 7 cells/5 mice; VIP-Tg: n = 7 cells/3 mice). (f) Summary plot showing changes in the number of APs during the train of APs in relation to the injected current in I-S3 cells. The shaded areas show the standard error of the mean (SEM). *p < 0.05 (VIP-nonTg: n = 7 cells/5 mice; VIP-Tg: n = 7 cells/3 mice).
Figure 2—figure supplement 1.
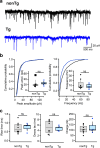
Figure 2—figure supplement 1.. Unaltered synaptic drive to I-S3 cells in VIP-Tg mice.
(a) Representative traces for spontaneous inhibitory (sIPSCs, left) and excitatory (sEPSCs, right) postsynaptic currents in I-S3 cells from VIP-nonTg (top, black) and VIP-Tg (bottom, blue) mice. (b) Summary plots showing the cumulative probability for sIPSCs amplitude (left) and frequency (middle left) as well as the sEPSCs amplitude (middle right) and frequency (right) in I-S3 cells from VIP-nonTg (black) and VIP-Tg (blue) groups. (c) Summary plots showing the animal-wise data for sIPSCs (VIP-nonTg: n = 7 cells/5 animals; VIP-Tg: n = 6 cells/5 animals) amplitude (left) and frequency (middle left) as well as the sEPSCs (VIP-nonTg: n = 5 cells/5 animals; VIP-Tg: n = 4 cells/4 animals) amplitude (middle right) and frequency (right) in I-S3 cells.
Figure 2—figure supplement 2.
Figure 2—figure supplement 2.. Unaltered morphological properties of I-S3 cells in VIP-Tg mice.
(a) Anatomical reconstructions of I-S3 cells filled with biocytin from VIP-nonTg (left) and VIP-Tg (right) animals. Scale bar: 50 μm. Summary plots showing the soma area (b), the total dendritic surface (c), the dendritic length (d), and the number of dendritic branching points (e) of I-S3 cells for VIP-nonTg and VIP-Tg groups (VIP-nonTg: n = 6 cells/5 animals; VIP-Tg: n = 5 cells/4 animals). (f) Sholl analysis of the dendritic length (left), number of intersections (middle) and number of dendritic nodes (right) in relation to the distance from the soma in I-S3 cells for VIP-nonTg and VIP-Tg groups (VIP-nonTg: n = 5 cells/5 animals; VIP-Tg: n = 5 cells/4 animals).
Figure 3.
Figure 3.. Altered inhibition of CA1 interneurons in Tg mice.
(a) Representative traces for spontaneous inhibitory postsynaptic currents (sIPSCs) in stratum oriens/alveus (O/A) INs from nonTg (top, black) and Tg (bottom, blue) mice. (b) Summary plots showing the sIPSCs amplitude (left) and frequency (right) in nonTg (black) and Tg (blue) groups. Insets show data for animal-wise comparison. **p < 0.01 (nonTg: n = 16 cells/5 mice; Tg: n = 10 cells/4 mice). (c) Summary plots showing the sIPSC rise time left, decay time constant (middle), and charge transfer (right) in O/A INs of nonTg and Tg animals. *p < 0.05, **p < 0.01 (nonTg: n = 16 cells/5 mice; Tg: n = 10 cells/4 mice). (d) Representative confocal images showing immunoreactivity for vesicular GABA transporter (VGAT) (left, scale bar: 20 μm) and VGAT + CR (right, scale bar: 5 μm) in the CA1 O/A of the nonTg (top) and Tg (bottom) mice. (e) Summary plots showing no changes in the density of VGAT- and VGAT/CR-expressing axonal boutons in the O/A (nonTg: n = 19 slices/4 animals; Tg: n = 21 slices/4 animals).
Figure 3—figure supplement 1.
Figure 3—figure supplement 1.. Excitatory drive to stratum oriens/alveus (O/A) INs remains unchanged in Tg mice.
(a) Representative traces for spontaneous excitatory postsynaptic currents (sEPSCs) in O/A INs from nonTg (top, black) and Tg (bottom, blue) mice. (b) Summary distribution plots showing the sEPSCs amplitude (left) and frequency (right). Insets show summary data for animal-wise comparison (nonTg: n = 8 cells/5 animals; Tg: n = 5 cells/4 animals). (c) Summary boxplots showing the rise time (left), decay time constant (middle), and charge transfer (right) for sEPSCs (nonTg: n = 8 cells/5 animals; Tg: n = 5 cells/4 animals).
Figure 4.
Figure 4.. Enhanced activation of CA1 interneurons during decision-making and object exploration.
(a) Schematic of cannula implantation and the experimental setup for wireless fiber photometry calcium imaging in freely behaving mice. (b) Representative confocal images of the CA1 hippocampal area showing the cannula track and GCaMPF6f expression in the CA1 parvalbumin- (PV-INs) or somatostatin-expressing (SOM-INs), with a bar graph summarizing the fraction of PV-INs and SOM-INs contributing to the photometry signal. White arrowheads depict examples of cell bodies expressing GCaMPF6f. Scale bars: top, 100 μm; bottom, 50 μm. (c) Summary plots showing the mean speed, mobility rate, total distance traveled (n = 13 animals per group), and the number of rearing episodes (nonTg: n = 9 animals; Tg: n = 7 animals) during the open field exploration in nonTg (black) and Tg (blue) animals. (d) Representative individual (top) and average (bottom) traces obtained from stratum oriens/alveus (O/A) INs in nonTg (left, black) and Tg (right, blue) mice during walking in the open field arena. (e) Summary plots showing the average (top) and peak (bottom) Z-scored values of calcium transients in O/A INs in nonTg (black) and Tg (blue) mice during walking (nonTg: n = 9 animals; Tg: n = 8 animals). (f) Schematic of the behavioral paradigm for the T-maze: correct-choice animals visit an alternative to the previously visited arm during the second trial. The decision zone (DZ) is illustrated with the shaded area. (g) Bar graph showing the percentage of alternation in T-maze test in nonTg and Tg animals (nonTg: n = 9 animals; Tg: n = 6 animals). (h) Summary plots showing the average (left) and peak (right) Z-scored values of calcium transients in O/A INs of nonTg (black) and Tg (blue) mice during exploration in the stem vs. DZ. Only mice making the correct choice (those that visited alternative to the previously visited arm) were included in this analysis. *p < 0.05 (nonTg: n = 5 animals; Tg: n = 5 animals). (i) Schematic of the arena used to examine the object-related modulation of neuronal activity (left), with summary plots showing the number of entries inside the object exploration zone (middle), and the average duration of object exploration episodes (right) (nonTg: n = 10 animals; Tg: n = 8 animals). (j) Representative average traces (left) obtained from O/A INs in nonTg (black) and Tg (blue) mice during object exploration and summary plot of the average Z-scored values of calcium transients recorded in interneurons during object exploration periods. *p < 0.05 (right, nonTg: n = 10 animals; Tg: n = 9 animals).
Figure 4—figure supplement 1.
Figure 4—figure supplement 1.. Unaltered activity of CA1 interneurons in home cage and open field and unchanged mobility in T-maze.
(a) Representative calcium traces from CA1 stratum oriens/alveus (O/A) INs in nonTg (black) and Tg (blue) mice recorded when animals were in their homecage. (b) Summary plots showing the peak amplitude (left) and frequency (right) of calcium transients in O/A INs in nonTg (black) and Tg (blue) animals in their homecage. Insets show boxplots for animal-wise mean comparison (nonTg: n = 9 animals; Tg: n = 8 animals). (c) Representative movement trajectories during open field maze (OFM) for nonTg (left, black) and Tg mice (right, blue). (d) Summary plots showing the animal-wise comparison for the mean Z-scored values of calcium transients during periods of locomotion (left), immobility (middle), and rearing (right) in the OFM (nonTg: n = 9 animals; Tg: n = 8 animals). (e) Summary plots showing the average speed (left), average mobility speed (middle), and total distance traveled (right) in the DZ of the T-maze (nonTg: n = 10 animals; Tg: n = 5 animals) in nonTg (black) and Tg (blue) animals. (f) Summary plots showing the average speed (left), average mobility speed (middle), and total distance traveled (right) in the stem part of the T-maze (nonTg: n = 10 animals; Tg: n = 5 animals) in nonTg (black) and Tg (blue) animals.
Figure 5.
Figure 5.. Altered activation of CA1 pyramidal cells during cognitive tasks.
(a) Representative confocal image of the CA1 hippocampal area showing the cannula track and GCaMPF6f expression in the CA1 principal cells (PCs). Scale bar: 100 μm. (b) Representative calcium traces and summary plots showing the peak amplitude (left) and frequency (right) of calcium transients recorded in the CA1 PCs in nonTg (black) and Tg (blue) mice when animals were in their homecage (nonTg: n = 4 animals; Tg: n = 5 animals). Insets show summary boxplots for animal-wise mean comparison. (c) Representative average traces obtained from PCs in nonTg (black) and Tg (blue) mice during walking. The shaded areas show the SEM. (d) Summary plots showing the peak and area under the curve (AUC) for Z-scored values of calcium transients in PCs of nonTg (black) and Tg (blue) mice during walking (nonTg: n = 4 animals; Tg: n = 5 animals). (e) Representative average traces obtained from PCs in nonTg (black) and Tg (blue) mice during exploration in the D-zone of T-maze. The shaded areas show the SEM. (f) Summary plots showing the average (left) and peak (right) Z-scored values of calcium transients in PCs of nonTg (black) and Tg (blue) mice during exploration in the stem vs. DZ. *p <0.05 (nonTg: n = 4 animals; Tg: n = 5 animals). (g) Representative average traces obtained from PCs in nonTg (black) and Tg (blue) mice during object exploration. The shaded areas show the SEM. (h) Summary plots showing the AUC (left) and the root mean square (RMS) for Z-scored values of calcium transients in PCs of nonTg (black) and Tg (blue) mice during object exploration. *p < 0.05 (nonTg: n = 4 animals; Tg: n = 5 animals).

Update of

  • doi: 10.1101/2024.01.12.575331
  • doi: 10.7554/eLife.95412.1
  • doi: 10.7554/eLife.95412.2

Similar articles

Cited by

References

    1. Acsády L, Arabadzisz D, Freund TF. Correlated morphological and neurochemical features identify different subsets of vasoactive intestinal polypeptide-immunoreactive interneurons in rat hippocampus. Neuroscience. 1996;73:299–315. doi: 10.1016/0306-4522(95)00610-9. - DOI - PubMed
    1. Adler G, Brassen S, Jajcevic A. EEG coherence in Alzheimer’s dementia. Journal of Neural Transmission. 2003;110:1051–1058. doi: 10.1007/s00702-003-0024-8. - DOI - PubMed
    1. Algamal M, Russ AN, Miller MR, Hou SS, Maci M, Munting LP, Zhao Q, Gerashchenko D, Bacskai BJ, Kastanenka KV. Reduced excitatory neuron activity and interneuron-type-specific deficits in a mouse model of Alzheimer’s disease. Communications Biology. 2022;5:1323. doi: 10.1038/s42003-022-04268-x. - DOI - PMC - PubMed
    1. Ali AB, Islam A, Constanti A. The fate of interneurons, GABAA receptor sub-types and perineuronal nets in Alzheimer’s disease. Brain Pathology. 2023;33:e13129. doi: 10.1111/bpa.13129. - DOI - PMC - PubMed
    1. Amalyan S, Tamboli S, Lazarevich I, Topolnik D, Bouman LH, Topolnik L. Enhanced motor cortex output and disinhibition in asymptomatic female mice with C9orf72 genetic expansion. Cell Reports. 2022;40:111043. doi: 10.1016/j.celrep.2022.111043. - DOI - PubMed

Substances