. 2024 Aug 31;13(8):4324-4340.
doi: 10.21037/tcr-23-2354. Epub 2024 Aug 26.

A novel tumor-derived exosomal gene signature predicts prognosis in patients with pancreatic cancer

Affiliations

A novel tumor-derived exosomal gene signature predicts prognosis in patients with pancreatic cancer

Yang Wang et al. Transl Cancer Res. .

Abstract

Background: Pancreatic cancer is a devastating disease with poor prognosis. Accumulating evidence has shown that exosomes and their cargo have the potential to mediate the progression of pancreatic cancer and are promising non-invasive biomarkers for the early detection and prognosis of this malignancy. This study aimed to construct a gene signature from tumor-derived exosomes with high prognostic capacity for pancreatic cancer using bioinformatics analysis.

Methods: Gene expression data of solid pancreatic cancer tumors and blood-derived exosome tissues were downloaded from The Cancer Genome Atlas (TCGA) and ExoRBase 2.0. Overlapping differentially expressed genes (DEGs) in the two datasets were analyzed, followed by functional enrichment analysis, protein-protein interaction networks, and weighted gene co-expression network analysis (WGCNA). Using the least absolute shrinkage and selection operator (LASSO) regression of prognosis-related exosomal DEGs, a tumor-derived exosomal gene signature was constructed based on the TCGA dataset, which was validated by an external validation dataset, GSE62452. The prognostic power of this gene signature and its relationship with various pathways and immune cell infiltration were analyzed.

Results: A total of 166 overlapping DEGs were identified from the two datasets, which were markedly enriched in functions and pathways associated with the cell cycle. Two key modules and corresponding 70 exosomal DEGs were identified using WGCNA. Using LASSO Cox regression of prognosis-related exosomal DEGs, a tumor-derived exosomal gene signature was built using six exosomal DEGs (ARNTL2, FHL2, KRT19, MMP1, CDCA5, and KIF11), which showed high predictive performance for prognosis in both the training and validation datasets. In addition, this prognostic signature is associated with the differential activation of several pathways, such as the cell cycle, and the infiltration of some immune cells, such as Tregs and CD8+ T cells.

Conclusions: This study established a six-exosome gene signature that can accurately predict the prognosis of pancreatic cancer.

Keywords: Pancreatic cancer; cell cycle; exosomes; gene signature; immune cell infiltration.


Conflict of interest statement

Conflicts of Interest: All authors have completed the ICMJE uniform disclosure form (available at https://tcr.amegroups.com/article/view/10.21037/tcr-23-2354/coif). The authors have no conflicts of interest to declare.

Figures

Figure 1
Figure 1
The flow chart of the bioinformatics analysis for this study. TCGA, The Cancer Genome Atlas; DEGs, differentially expressed genes; WGCNA, weighted gene co-expression network analysis; GO, Gene Ontology; BP, biological process; KEGG, Kyoto Encyclopedia of Genes and Genomes; PPI, protein-protein interaction; LASSO, least absolute shrinkage and selection operator.
Figure 2
Figure 2
Analysis of DEGs based on TCGA and exoRBase 2.0 datasets, and functional enrichment analysis of the overlapping DEGs in the two datasets. (A) Volcanic plots of the DEGs based on TCGA and exoRBase 2.0 datasets, respectively. Red and blue dots indicate up-regulated and down-regulated DEGs, respectively. (B) Venn diagram showed the number of up- and down-regulated overlapping DEGs in the two datasets, as well as 166 overlapping DEGs were identified. (C) The top ten GO terms of biological process enriched by the overlapping DEGs, such as cell division, immune response, and cell cycle. (D) The top ten KEGG pathways of the identified overlapping DEGs, such as cell cycle, PI3K-Akt signaling pathway, and Hippo signaling pathway. FDR, false discovery rate; FC, fold change; TCGA, The Cancer Genome Atlas; DEGs, differentially expressed genes; GO, Gene Ontology; KEGG, Kyoto Encyclopedia of Genes and Genomes.
Figure 3
Figure 3
Analysis of PPI networks and functional enrichment analysis of DEGs in the four modules of PPI networks. (A) A PPI network constructed by the overlapping DEGs in the TCGA and exoRBase 2.0 datasets. Red nodes indicate up-regulated DEGs, and blue nodes represent down-regulated DEGs. The size of a node indicates the degree of a node, and a larger node indicates a higher degree of a node. (B) Four modules of the PPI network were identified by Mcode plug-in in Cytoscape. Red and blue nodes indicate up-regulated and down-regulated DEGs, respectively. (C) The GO terms of biological process of the genes in each module of the PPI network, such as extrinsic apoptotic signaling pathway, fibrinolysis, immune response, and cell cycle. (D) KEGG pathways of the genes in each module of the PPI network, such as cholesterol metabolism, PI3K-Akt signaling pathway, oocyte meiosis, and cell cycle. PAAD, pancreatic cancer; PPI, protein-protein interaction; DEGs, differentially expressed genes; TCGA, The Cancer Genome Atlas; GO, Gene Ontology; KEGG, Kyoto Encyclopedia of Genes and Genomes.
Figure 4
Figure 4
Construction of co-expression modules associated with pancreatic cancer by WGCNA. (A) The correlation analysis of the TCGA and exoRBase 2.0 datasets. The gene expression of the two datasets were positively correlated (cor =0.54, P<1e−200), with the connectivity (cor =0.16, P=1.7e−11), indicating that the data in the two dataset were comparable. (B) Analysis of network topology for various soft-threshold powers. (C) Identification of pancreatic cancer-specific modules based on the TCGA dataset. (D) Identification of pancreatic cancer-specific modules based on the exoRBase 2.0 dataset. Each vertical line indicates a gene and each branch represents an expression module of highly interconnected genes. Below the dendrogram, different modules are given different colors. Gray indicated that genes are outside all modules. (E) The relationships between the identified nine modules and pancreatic cancer. A change in color from blue to red indicates a change in correlation from negative to positive. WGCNA, weighted gene co-expression network analysis; TCGA, The Cancer Genome Atlas.
Figure 5
Figure 5
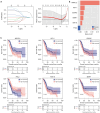
The optimal combination of exosomal DEGs screened by LASSO. (A) The LASSO coefficient spectrum of the six independent prognostic DEGs (left) and optimized lambda determined in the LASSO regression model (right). (B) The LASSO regression coefficient of the six exosomal DEGs. (C) Kaplan-Meier survival curves showed the prognostic values of these six exosomal DEGs. DEGs, differentially expressed genes; LASSO, least absolute shrinkage and selection operator.
Figure 6
Figure 6
Construction and validation of the prognostic signature. TCGA dataset was used as the training dataset and GSE62452 dataset was used as the validation dataset. (A) Kaplan-Meier survival curves showed the survival differences between the two risk groups. (B) The scatterplots showed the distribution of the risk score and survival time of patients. The black dots mean survival, and the red dots mean death. (C) ROC curves revealed the predictive performance of the constructed prognostic signature for pancreatic cancer survival and prognosis. TCGA, The Cancer Genome Atlas; HR, hazard ratio; CI, confidence interval; AUC, area under the ROC curve; ROC, receiver operating characteristic.
Figure 7
Figure 7
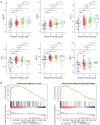
The relationships between each DEG and grade of pancreatic cancer, as well as KEGG analysis. (A) The relationships between ARNTL2, KRT19, MMP1, CDCA5 KIF11 or FHL2 and neoplasm histological grade of pancreatic cancer. (B) GSEA showed the crucial KEGG pathways significantly associated with the prognostic signature. KEGG, Kyoto Encyclopedia of Genes and Genomes; GSEA, gene set enrichment analysis; DEG, differentially expressed gene.
Figure 8
Figure 8
Association of the prognostic signature with immune cell infiltration and pathways. (A) The distribution of six types of immune cells with significantly different proportions in different risk groups. (B) The correlation between the infiltration levels of the six significantly differentially distributed immune cells and the six DEGs used to construct the prognostic signature in pancreatic cancer samples from the TCGA dataset. (C) The correlation between the infiltration levels of six significantly differentially distributed immune cells and the six DEGs used to construct the prognostic signature in pancreatic cancer samples from the exoRBase 2.0 dataset. DEGs, differentially expressed genes; TCGA, The Cancer Genome Atlas.

Similar articles

References

    1. Sung H, Ferlay J, Siegel RL, et al. Global Cancer Statistics 2020: GLOBOCAN Estimates of Incidence and Mortality Worldwide for 36 Cancers in 185 Countries. CA Cancer J Clin 2021;71:209-49. 10.3322/caac.21660 - DOI - PubMed
    1. Kolbeinsson HM, Chandana S, Wright GP, et al. Pancreatic Cancer: A Review of Current Treatment and Novel Therapies. J Invest Surg 2023;36:2129884. 10.1080/08941939.2022.2129884 - DOI - PubMed
    1. Yousuf S, Qiu M, Voith von Voithenberg L, et al. Spatially Resolved Multi-Omics Single-Cell Analyses Inform Mechanisms of Immune Dysfunction in Pancreatic Cancer. Gastroenterology 2023;165:891-908.e14. 10.1053/j.gastro.2023.05.036 - DOI - PubMed
    1. Tarasiuk A, Mackiewicz T, Małecka-Panas E, et al. Biomarkers for early detection of pancreatic cancer - miRNAs as a potential diagnostic and therapeutic tool? Cancer Biol Ther 2021;22:347-56. 10.1080/15384047.2021.1941584 - DOI - PMC - PubMed
    1. Tan F, Li X, Wang Z, et al. Clinical applications of stem cell-derived exosomes. Signal Transduct Target Ther 2024;9:17. 10.1038/s41392-023-01704-0 - DOI - PMC - PubMed

LinkOut - more resources