. 2024 Sep 11;43(1):258.
doi: 10.1186/s13046-024-03178-6.

Tumor-associated neutrophils upregulate Nectin2 expression, creating the immunosuppressive microenvironment in pancreatic ductal adenocarcinoma

Affiliations

Tumor-associated neutrophils upregulate Nectin2 expression, creating the immunosuppressive microenvironment in pancreatic ductal adenocarcinoma

Haizhen Luo et al. J Exp Clin Cancer Res. .

Abstract

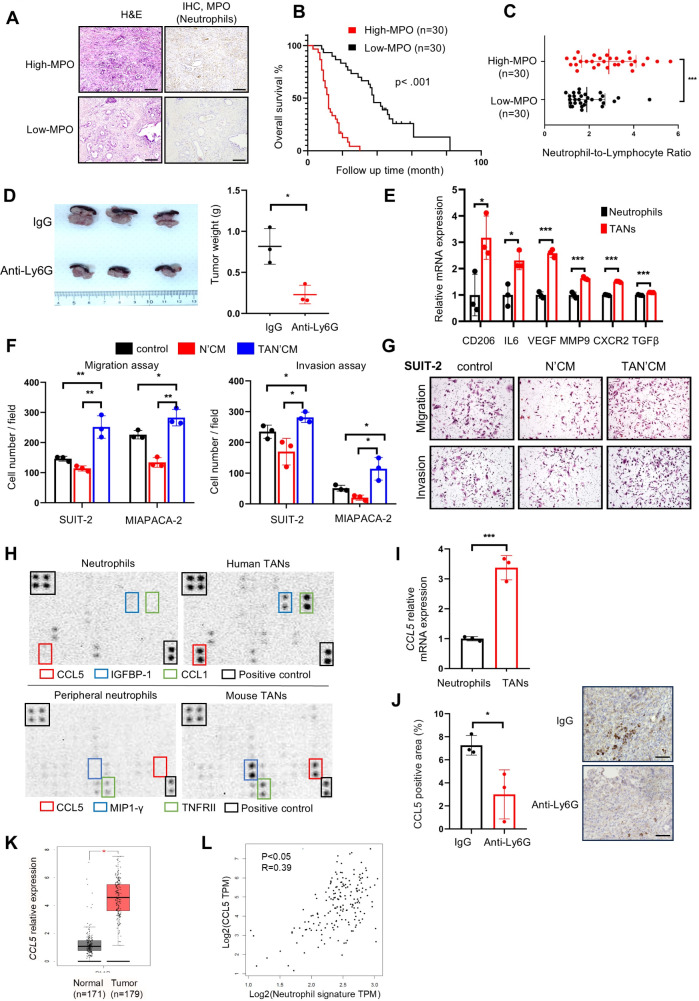
Background: Tumor-associated neutrophils (TANs) constitute an abundant component among tumor-infiltrating immune cells and have recently emerged as a critical player in pancreatic ductal adenocarcinoma (PDAC) progression. This study aimed to elucidate the pro-tumor mechanisms of TAN and identify a novel target for effective immunotherapy against PDAC.

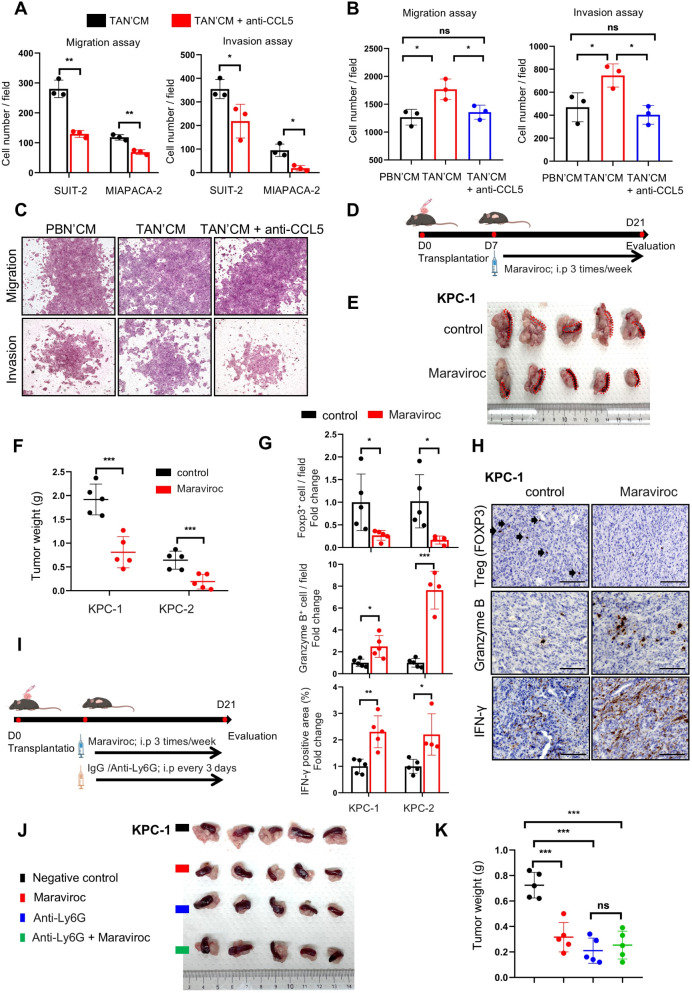
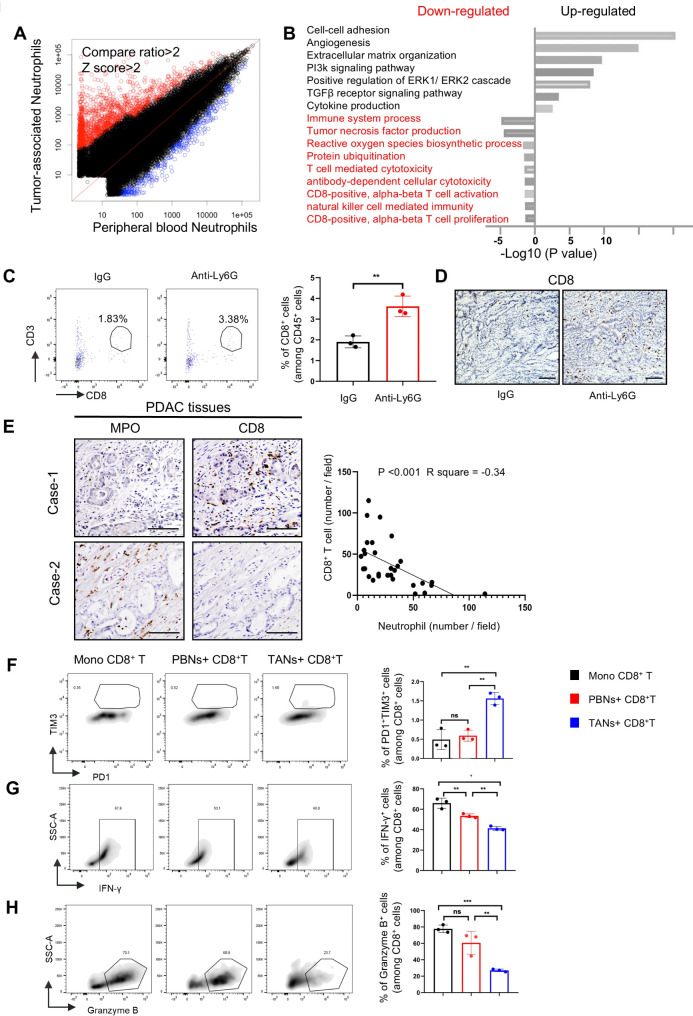
Methods: Microarray and cytokine array analyses were performed to identify the mechanisms underlying the function of TANs. Human and mouse TANs were obtained from differentiated HL-60 cells and orthotopically transplanted PDAC tumors, respectively. The interactions of TANs with cancer and cytotoxic T-cells were evaluated through in vitro co-culture and in vivo orthotopic or subcutaneous models. Single-cell transcriptomes from patients with PDAC were analyzed to validate the cellular findings.

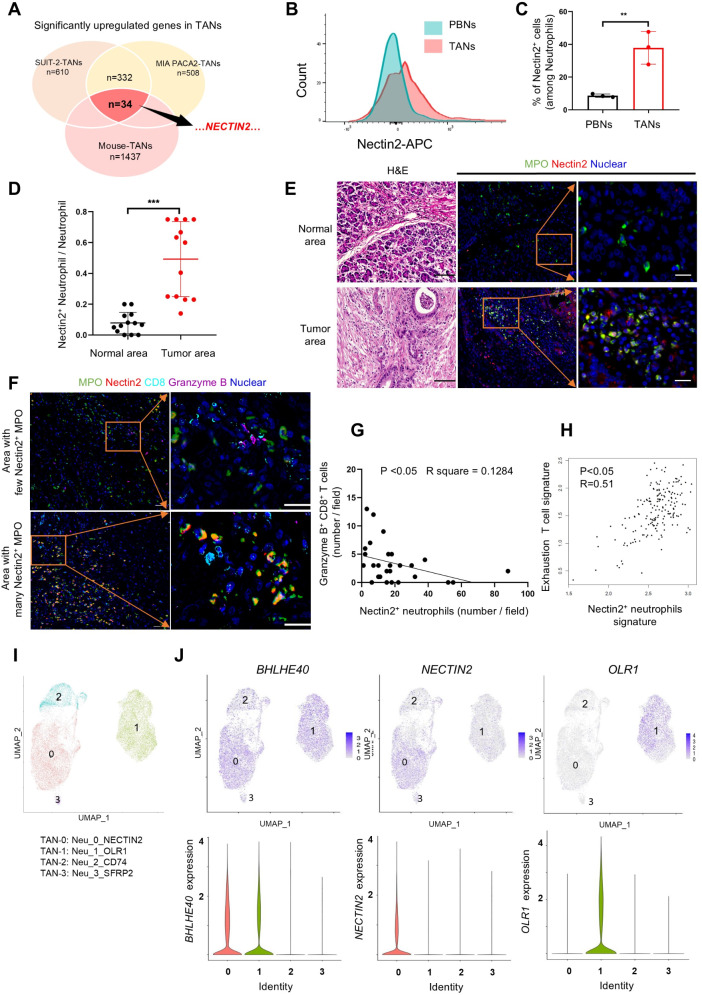
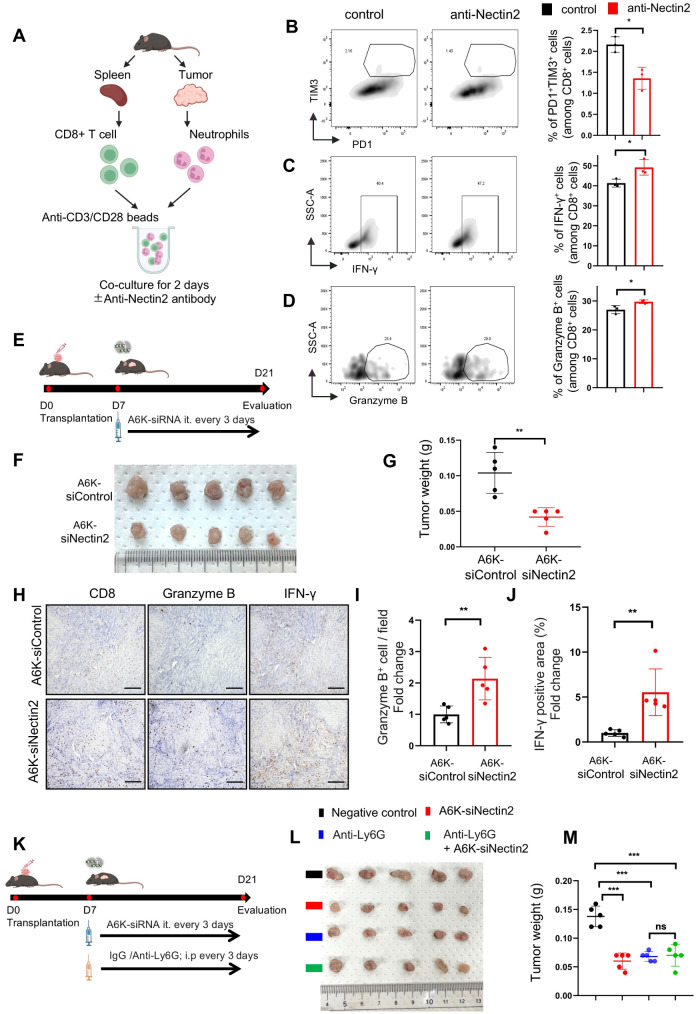
Results: Increased neutrophil infiltration in the tumor microenvironment was associated with poor survival in patients with PDAC. TANs secreted abundant amounts of chemokine ligand 5 (CCL5), subsequently enhancing cancer cell migration and invasion. TANs subpopulations negatively correlated with cytotoxic CD8+ T-cell infiltration in PDAC and promoted T-cell dysfunction. TANs upregulated the membranous expression of Nectin2, which contributed to CD8+ T-cell exhaustion. Blocking Nectin2 improved CD8+ T-cell function and suppressed tumor progression in the mouse model. Single-cell analysis of human PDAC revealed two immunosuppressive TANs phenotypes: Nectin2+ TANs and OLR1+ TANs. Endoplasmic reticulum stress regulated the protumor activities in TANs.

Conclusions: TANs enhance PDAC progression by secreting CCL5 and upregulating Nectin2. Targeting the immune checkpoint Nectin2 could represent a novel strategy to enhance immunotherapy efficacy in PDAC.

Keywords: Chemokine ligand 5; Nectin2; Pancreatic cancer; Tumor immune microenvironment; Tumor-associated neutrophils.


Conflict of interest statement

The authors declare that they have no competing interests.

Figures

Fig. 1
Fig. 1
Tumor-associated neutrophils (TANs) infiltration is implicated in poor prognosis in pancreatic ductal adenocarcinoma (PDAC) and abundantly secretes CCL5 through polarization. (A) Representative images of H&E and immunohistochemistry of myeloperoxidase (MPO) in human PDAC. High- (top) and low-MPO (bottom) indicate abundant and scarce infiltration of neutrophils in the tumor microenvironment (TME), respectively. Scale bar, 200 μm. (B) Kaplan–Meier survival analysis of neutrophil infiltration in PDAC, as defined by MPO expression. The p-value was obtained through the log-rank test. (C) Correlation between the extent of neutrophil infiltration in the tumor and the neutrophil-to-lymphocyte ratio in the peripheral blood of 60 patients with PDAC. (D) KPC-2 cells were transplanted into the pancreas of C57BL/6 mice to establish an orthotopic tumor model. Anti-Ly6G antibody was injected intraperitoneally in the orthotopic tumor mice at 1 week after transplantation to deplete neutrophils. Pancreatic tumors were harvested after 2 weeks of administration of Anti-Ly6G or IgG antibody. Representative in situ images and quantified graph of tumor weight. (E) Relative expression levels of N2 marker genes in HL60 cell-differentiated neutrophils and TANs. Expression levels of the 18 S gene were used as an internal control (n = 3 per group). (F) Effects of TANs on the migration and invasion of pancreatic cancer cells (SUIT-2 and MIA PACA-2), as assessed using transwell assays (n = 3 per group). (G) Representative microphotographs of migrating (top) and invading (bottom) SUIT-2 cells. (H) Representative human cytokine array images (upper panels) of the supernatant derived from HL60-differentiated neutrophils and neutrophils treated with a conditioned medium of SUIT-2 cells. Red, blue, green, and black boxes represent CCL5, IGBP-1, CCL1, and positive control, respectively. The lower panels display the cytokine array images of supernatant from neutrophils isolated from mouse peripheral blood and TANs isolated from orthotopically implanted pancreatic tumors in mice. Red, blue, green, and black boxes represent CCL5, MIP1-gamma, TNFRII, and the positive control, respectively. (I) The qRT-PCR validation of CCL5 mRNA expression in TANs. Relative expression levels of CCL5 in neutrophils and TANs were normalized based on the corresponding expression levels of 18 S. (n = 3 per group). (J) Immunohistochemistry of CCL5 in mice samples with or without TANs in the TME. Scale bar, 50 μm. (K) Gene expression profiling interactive analysis of CCL5 in normal (gray bars) and tumor (red bars) samples from pancreatic cancer data from The Cancer Genome Atlas (TCGA) and Genotype-Tissue Expression databases. (L) Pearson correlation analysis of the mRNA expression levels of neutrophil signature (S100A9 S100A8 CSF3R) and CCL5 in patients with PADC; data were extracted from the TCGA database. *p < 0.05, **p < 0.01, ***p < 0.001
Fig. 2
Fig. 2
TANs promote tumor progression through the CCL5-CCR5 axis. (A) The anti-CCL5 neutralizing antibody suppressed the migration and invasion of SUIT-2 and MIA PACA-2 cells treated with conditioned TANs (TAN’CM) medium, as assessed using transwell assays (n = 3 per group). (B) Migration and invasion of KPC-1 mouse pancreatic cancer cells treated with conditioned medium from neutrophils in mouse peripheral blood (PBN’CM) or those isolated from orthotopic pancreatic tumors (TAN’CM) with or without the anti-CCL5 antibody. (C) Representative microphotographs of migrating (top) and invading (bottom) KPC-1 cells. (D) Experimental schema demonstrating the orthotopic implantation of KPC-1 or KPC-2 cells into C57/B6 mice, n = 5. (E) Representative in situ images of tumors from KPC-1 cells and (F) quantified graphs of tumor weight in KPC-1 or KPC-2-transplanted mice after treatment. (G) Quantification for the immunohistochemistry of FOXP3+, Granzyme B+, and IFN-γ+ cells in orthotopically transplanted mice tumors. (H) Representative images for the immunohistochemistry of FOXP3+, Granzyme B+, and IFN γ+ cells in orthotopically transplanted mouse tumors. Arrows indicate positive staining. Scale bar, 100 μm. (I) Experimental schema showing the orthotopic implantation of KPC-2 cells into female C57/B6 mice and subsequent intraperitoneal injection with anti-Ly6G and maraviroc; n = 5. (J) Photographs of resected tumors and (K) quantified graphs of tumor weight in KPC-2-transplanted mice after treatment. *p < 0.05, **p < 0.01, ***p < 0.001; ns, not significant
Fig. 3
Fig. 3
TANs suppress CD8 + T cells infiltration and their antitumor activities. (A) A gene plot for microarray analysis between TANs and peripheral blood neutrophils from orthotopically transplanted mouse tumors. (B) Top-ranked enriched pathways that were upregulated (black) and downregulated (red) in TANs compared with those in mouse peripheral blood neutrophils, as determined using gene ontology analysis. (C) Representative images of flow cytometry and (D) immunohistochemistry for CD8+ T-cells in orthotopically transplanted mouse tumors with or without neutrophil depletion. CD45+ cells are presented in the flow cytometry. Scale bars, 100 μm. (E) Representative images of immunohistochemistry for neutrophils (MPO) and CD8+ cells in the resected PDAC tissues. Scale bars, 100 μm (left). Case-1 represents severe TAN infiltration with few CD8 cells, whereas Case-2 represents limited TAN infiltration with abundant CD8 cells. The correlation between the number of neutrophils and CD8+ cells per field of view at 200× magnification in PDAC tissues was statistically analyzed (right, n = 31). (F–H) The percentages of PD1+TIM3+CD8+ T- (F), IFN-γ-producing CD8+ T- (G), and Granzyme B-producing CD8+ T- (H) cells were evaluated using flow cytometry (n = 3). **p < 0.01, ***p < 0.001; ns, not significant
Fig. 4
Fig. 4
Nectin2 expression increased in tumor-associated neutrophils and was related to protumor immunity. (A) Microarray analysis results show the number of genes whose expression in TANs was upregulated under varying experimental conditions. (B) and (C) Flow cytometry analysis of Nectin2 expression in neutrophils from peripheral blood (PBNs) and tumor-associated neutrophils (TANs) in mice. The percentage of Nectin2+ neutrophils is shown. (D) and (E) indicate the percentage of Nectin2+ neutrophils (double positive for Nectin2 and MPO) of all neutrophils in the tumor area and adjacent normal pancreas in resected PDAC tissues (D, n = 13). Representative images of H&E and immunofluorescence for MPO (green) and Nectin2 (red) in the adjacent normal pancreas (top panels) and tumor area (bottom panels) (E). Yellow indicates Nectin2+ TANs. Scale bar, 100 μm in H&E and 20 μm in immunofluorescence. (F) Representative images of multi-immunohistochemistry for Nectin2+ neutrophils (double positive for Nectin2 and MPO) and Granzyme B+ CD8+ T-cells (double positive for Granzyme B and CD8) in PDAC. Case-1 shows an area with less Nectin2+ TAN infiltration and abundant Granzyme B+ CD8+ T-cells. Case 2 shows an area with severe Nectin2+ TANs infiltration and fewer Granzyme B+ CD8+ T-cells. Scale bars, 20 μm. (G) The number of Nectin2+ neutrophils and Granzyme B+ CD8+ cells per field of view at 200× magnification, as counted in 35 fields from seven PDAC tissues. (H) Pearson correlation analysis of the mRNA levels in Nectin2+ neutrophil (CD112, S100A9, S100A8, CSF3R) and exhausted T-cell (HAVCR2, TIGIT, LAG3, PDCD1, CXCL13, LAYN) signatures in 177 human PDAC from the TCGA database. (I) Single-cell RNA sequence analysis of the public dataset GSE205013 [26], which comprises cells from 27 freshly collected human PDAC samples. After segregation of neutrophils from CD45+ cells in the tumors as shown in online supplemental Fig. 6A–B, uniform manifold approximation and projection (UMAP) visualization re-clustered neutrophils into 4 clusters (0: TAN-0_NECTIN2, 1: TAN-1_OLR1, 2: TAN-2_CD74, 3: TAN-3_SFRP2). Detailed characteristics of each cluster are shown in the online supplemental Table 1. (J) UMAP of neutrophils separately featuring the expression of BHLHE40 (left), NECTIN2 (middle), and OLR1 (right) in each population. **p < 0.01, ***p < 0.001
Fig. 5
Fig. 5
Inhibiting Nectin2 increases antitumor ability in CD8 + T cells. (A) Experimental schema showing the co-culture of CD8+ T-cells with autologous neutrophils from KPC tumors with or without anti-Nectin2 antibody. (B-D) The percentages of PD1+TIM3+CD8+ T- (B), IFN-γ-producing CD8+ T- (C), and granzyme B-producing CD8+ T- (D) cells calculated using flow cytometry (n = 3). (E) Experimental schema showing the subcutaneous implantation of KPC-2 cells into female C57/B6 mice and subsequent intratumoral injection with A6K-siNectin2 or A6K-siRNA control (A6K-siControl); n = 5. (F) Photographs of resected tumors treated with A6K-siControl or A6K-siNectin2. (G) Graphs showing tumor weight after A6K-siNectin2 treatment. (H) Representative immunohistochemistry of CD8, Granzyme B, and IFN-γ in the serial sections of the subcutaneous tumors triggered through transplantation of KPC-2 cells. Scale bar, 200 μm. (I and J) Statistical analysis of Granzyme B+ (I) and IFN γ+ (J) cells in the tumors; n = 5. (K) Experimental schema showing the subcutaneous implantation of KPC-2 cells into female C57/B6 mice and subsequent intraperitoneal injection with anti-Ly6G and intratumoral injection with A6K-siNectin2; n = 5. (L) Photographs of resected tumor and (M) quantified graphs of tumor weight in KPC-2-transplanted mice after treatment. *p < 0.05, **p < 0.01, ***p < 0.001
Fig. 6
Fig. 6
ER stress increased in TANs, producing protumor functions. (A). Gene ontology analysis of genes whose expression was upregulated in human TANs compared with original neutrophils. (B) Heatmap of genes involved in the response to unfolded proteins (UPR) between neutrophils and TANs. (C) Western blotting results show ER stress-related proteins (p-ERK and BIP1) in human neutrophils differentiated from HL60 cells and those treated with the supernatant of SUIT-2 cells (TANs) (left panels). Western blotting results identifying ER stress-related proteins (BIP and CHOP) in neutrophils from peripheral blood (PBNs) and orthotopically implanted tumors (TANs) in mice (right panels). β-actin was used as a loading control. (D) Relative expression levels of ER stress-related genes in humans (left panel, 18 S served as an internal control) and mouse (right panel, GAPDH served as an internal control) neutrophils during phenotype switch. (n = 3 per group). (E) Relative expression levels of N2 marker genes in human (TANs) and 4-Phenylbutyric acid (4-PBA)-pretreated TANs (4PBA-TANs). The mRNA expression level of each gene was normalized to fold over 18 S. (n = 3 per group). (F) Western blotting results demonstrating BHLHE40 expression in neutrophils, TANs, and 4PBA-TANs. β-actin was used as a loading control. (G) Relative expression levels of CCL5 mRNA in TANs and 4PBA-TANs. (n = 3 per group). (H-I) Flow cytometry analysis of Nectin2 expression in TANs and 4PBA-TANs (H). The percentage of Nectin2 + neutrophils (I). (J) The migration and invasion of SUIT-2 and MIA PACA-2 cells treated with TAN’CM or 4PBA-TAN’CM, as assessed using transwell assays (n = 3 per group). *p < 0.05, **p < 0.01, ***p < 0.001
Fig. 7
Fig. 7
Graphical summary depicting the role of tumor-associated neutrophils in the immunosuppressive tumor microenvironment of PDAC. Neutrophils stimulated by cancer cells become the protumor phenotype through increased ER stress. Polarized tumor-associated neutrophils upregulate CCL5 secretion, which promotes cancer cell migration and invasion and enhances Treg cell infiltration in the tumor. In addition, a subpopulation of tumor-associated neutrophils upregulates Nectin2 expression, directly impeding the secretion of IFN-γ and Granzyme B by CD8+ T-cells through immune checkpoint signaling. Blockade of the CCL5–CCR5 axis or Nectin2 boosted CD8+ T-cell cytotoxicity, inhibiting tumor progression in PDAC

Similar articles

References

    1. Siegel RL, Giaquinto AN, Jemal A. Cancer statistics, 2024. CA Cancer J Clin. 2024;74:12–49. 10.3322/caac.21820 - DOI - PubMed
    1. Looi C-K, Chung FF-L, Leong C-O, Wong S-F, Rosli R, Mai C-W. Therapeutic challenges and current immunomodulatory strategies in targeting the immunosuppressive pancreatic tumor microenvironment. J Exp Clin Cancer Res. 2019;38:1–23. 10.1186/s13046-019-1153-8 - DOI - PMC - PubMed
    1. Ho WJ, Jaffee EM, Zheng L. The tumour microenvironment in pancreatic cancer—clinical challenges and opportunities. Nat Reviews Clin Oncol. 2020;17:527–40.10.1038/s41571-020-0363-5 - DOI - PMC - PubMed
    1. Gentles AJ, Newman AM, Liu CL, Bratman SV, Feng W, Kim D, et al. The prognostic landscape of genes and infiltrating immune cells across human cancers. Nat Med. 2015;21:938–45. 10.1038/nm.3909 - DOI - PMC - PubMed
    1. Shaul ME, Fridlender ZG. Tumour-associated neutrophils in patients with cancer. Nat Rev Clin Oncol. 2019;16:601–20. 10.1038/s41571-019-0222-4 - DOI - PubMed

MeSH terms