. 2024 Oct;634(8033):492-500.
doi: 10.1038/s41586-024-07909-9. Epub 2024 Sep 11.

Mechanism of BRCA1-BARD1 function in DNA end resection and DNA protection

Affiliations

Mechanism of BRCA1-BARD1 function in DNA end resection and DNA protection

Ilaria Ceppi et al. Nature. 2024 Oct.

Abstract

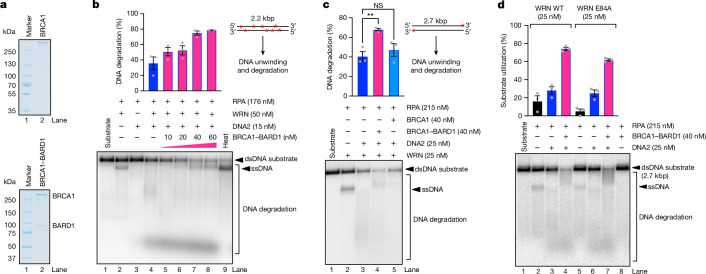
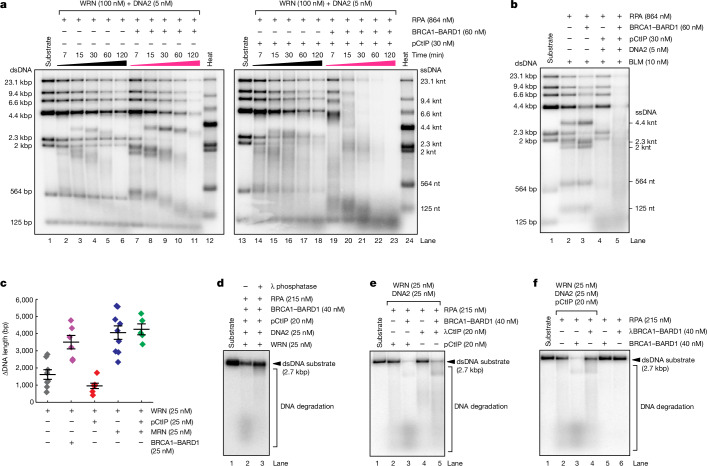
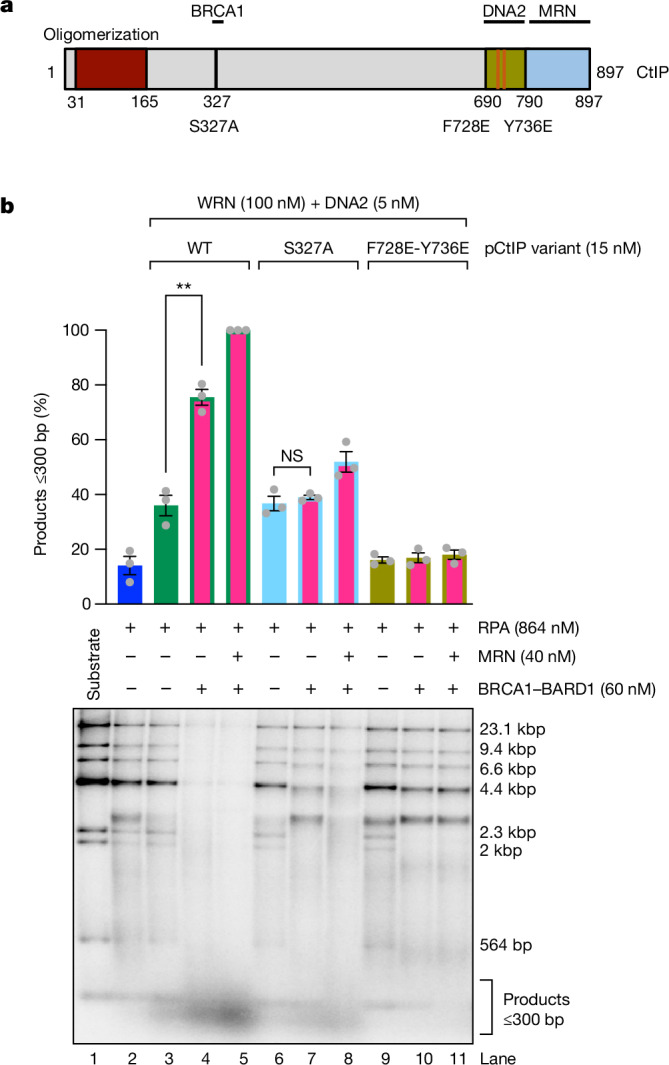
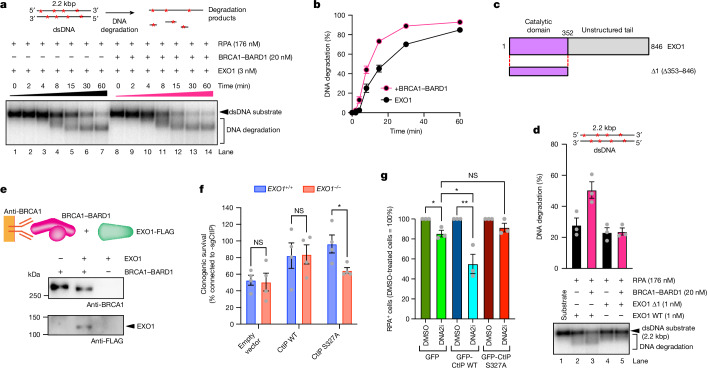
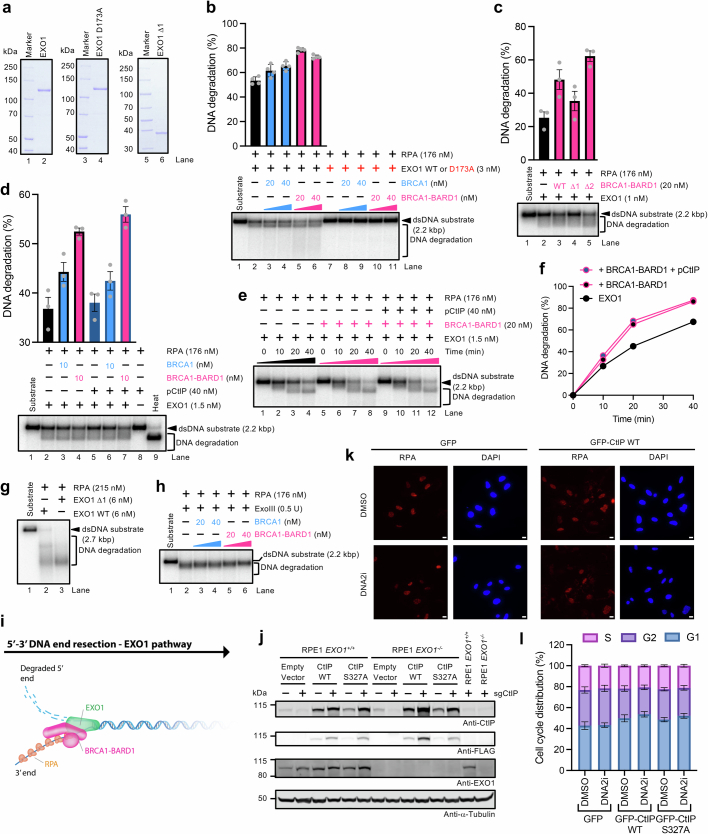
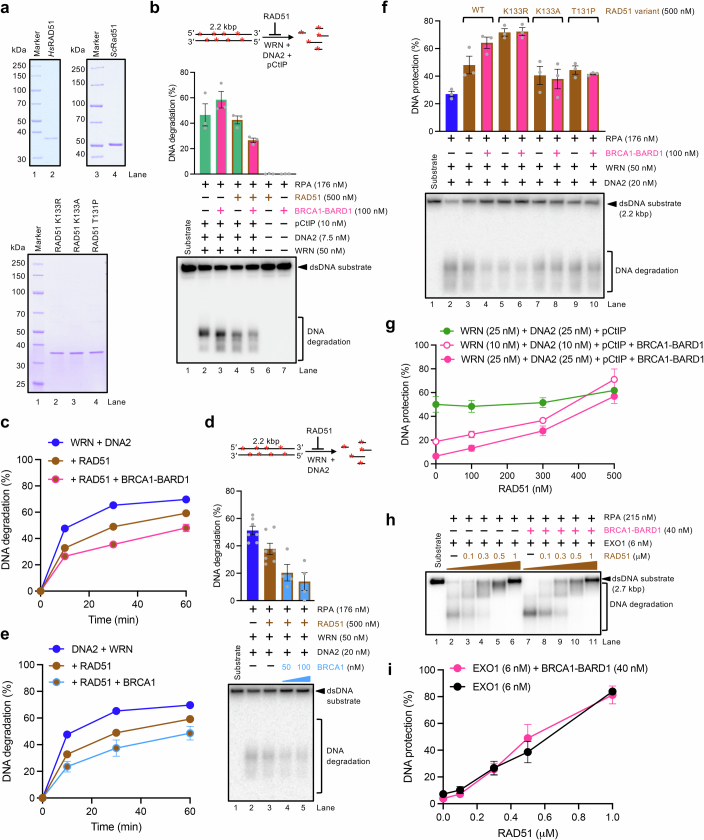
DNA double-strand break (DSB) repair by homologous recombination is initiated by DNA end resection, a process involving the controlled degradation of the 5'-terminated strands at DSB sites1,2. The breast cancer suppressor BRCA1-BARD1 not only promotes resection and homologous recombination, but it also protects DNA upon replication stress1,3-9. BRCA1-BARD1 counteracts the anti-resection and pro-non-homologous end-joining factor 53BP1, but whether it functions in resection directly has been unclear10-16. Using purified recombinant proteins, we show here that BRCA1-BARD1 directly promotes long-range DNA end resection pathways catalysed by the EXO1 or DNA2 nucleases. In the DNA2-dependent pathway, BRCA1-BARD1 stimulates DNA unwinding by the Werner or Bloom helicase. Together with MRE11-RAD50-NBS1 and phosphorylated CtIP, BRCA1-BARD1 forms the BRCA1-C complex17,18, which stimulates resection synergistically to an even greater extent. A mutation in phosphorylated CtIP (S327A), which disrupts its binding to the BRCT repeats of BRCA1 and hence the integrity of the BRCA1-C complex19-21, inhibits resection, showing that BRCA1-C is a functionally integrated ensemble. Whereas BRCA1-BARD1 stimulates resection in DSB repair, it paradoxically also protects replication forks from unscheduled degradation upon stress, which involves a homologous recombination-independent function of the recombinase RAD51 (refs. 4-6,8). We show that in the presence of RAD51, BRCA1-BARD1 instead inhibits DNA degradation. On the basis of our data, the presence and local concentration of RAD51 might determine the balance between the pronuclease and the DNA protection functions of BRCA1-BARD1 in various physiological contexts.


Conflict of interest statement

The authors declare no competing interests.

Figures

Fig. 1
Fig. 1. BRCA1–BARD1 directly promotes resection by WRN-DNA2-RPA.
a, Recombinant BRCA1 (top) and the BRCA1–BARD1 (bottom) complex used in this study. The polyacrylamide gels were stained with Coomassie Brilliant Blue. b, Resection assays with WRN-DNA2-RPA, and its stimulation by BRCA1–BARD1. Top right, a schematic of the assay. Red asterisks (*) represent the position of the radioactive labels. Top, quantitation of DNA degradation. Averages shown; error bars, s.e.m. (lanes 4–7); n = 2 for the reaction containing 60 nM of BRCA1–BARD1 and n = 3 for all the other samples. Bottom, representative assays. c, Resection assays with WRN-DNA2-RPA, in the absence or presence of either BRCA1–BARD1 or BRCA1. Top right, a schematic of the assay. Red asterisks (*) represent the position of the radioactive labels. Top, quantitation of DNA degradation. Averages shown; error bars, s.e.m.; n = 3. **P = 0.0055, two-tailed t-test. Bottom, representative assays. d, Resection assays with DNA2-RPA, and either wild-type (WT) WRN or exonuclease-dead WRN E84A, in the absence or presence of BRCA1–BARD1. Top, quantitation of the substrate utilization. Averages shown; error bars, s.e.m.; n = 3. Bottom, representative assays. Source data are provided in Supplementary Fig. 1. NS, not significant. Source Data
Fig. 2
Fig. 2. BRCA1–BARD1 promotes WRN-mediated DNA unwinding.
a, A schematic of the single-molecule magnetic tweezers assay setup used and the DNA substrate. b, Representative trajectory of DNA unwinding events by WRN in the presence of RPA, both 25 nM. A zoomed-in view highlighting unwinding and rewinding events is shown in the dashed square. Scale bar, 10 s. c, Representative trajectory of DNA unwinding events by WRN (25 nM) in the presence of BRCA1–BARD1 (40 nM) and RPA (25 nM). d,e, Processivity histogram (d) and cumulative (Cum.) probability distribution (shown as survival probability) (e) of the observed DNA unwinding events by WRN-RPA, both 25 nM, in the absence (grey) or presence (pink) of BRCA1–BARD1 (40 nM), with mean values of 160 ± 14 bp (n = 104) and 283 ± 26 bp (n = 98), respectively. Error, 2 s.e.m. f,g, Velocity histogram (f) and cumulative probability distribution (shown as survival probability) (g) of the observed DNA unwinding events by WRN-RPA, both 25 nM, in the absence (grey) or presence (pink) of BRCA1–BARD1 (40 nM), with mean values of 26 ± 3 bp per second (n = 104) and 34 ± 4 bp per second (n = 98), respectively. Error, 2 s.e.m. h, Ratio of rewinding (DNA shortening) and unwinding (DNA extension) events by WRN-RPA, both 25 nM, in the absence (grey) or presence (pink) of BRCA1–BARD1 (40 nM). Averages shown; error bars, s.e.m.; n = 15 (in the absence of BRCA1–BARD1) and n = 7 (in the presence of BRCA1–BARD1). i, Representative protein-interaction assays. Top, a schematic of the assay. Source data are provided in Supplementary Fig. 1. nt, nucleotides; s, second. Source Data
Fig. 3
Fig. 3. BRCA1–BARD1 together with CtIP and MRN promote resection by WRN-DNA2-RPA.
a, Representative kinetic resection assays with WRN-DNA2-RPA, in the absence or presence of pCtIP and BRCA1–BARD1. b, Representative resection assays with BLM-DNA2-pCtIP-RPA, in the absence or presence of BRCA1–BARD1. c, DNA unwinding by the indicated proteins, at 25 nM, expressed as ΔDNA-length (Methods). Averages shown; error bars, s.e.m.; n = 7 (for WRN), n = 6 (for WRN-BRCA1–BARD1), n = 7 (for WRN-BRCA1–BARD1-pCtIP), n = 9 (for WRN-MRN-BRCA1–BARD1), n = 5 (for WRN-pCtIP-MRN). d, Representative resection assays with WRN-DNA2-pCtIP-BRCA1–BARD1-RPA, in the absence or presence of λ phosphatase (200 U). e, Representative resection assays with WRN-DNA2-RPA, in the presence of pCtIP or dephosphorylated CtIP (λCtIP) and in the absence or presence of BRCA1–BARD1. f, Representative resection assays with WRN-DNA2-pCtIP-RPA, in the absence or presence of either BRCA1–BARD1 (BRCA1–BARD1) or dephosphorylated BRCA1–BARD1 (λBRCA1–BARD1). Source data are provided in Supplementary Fig. 2. knt, kilonucleotides. Source Data
Fig. 4
Fig. 4. The integrity of the BRCA1–C complex is required to promote resection.
a, Cartoon of the primary structure of the CtIP protein. Point mutants used in this study are highlighted. b, Resection assays with WRN-DNA2-RPA, in the absence or presence of the indicated pCtIP variant, MRN and BRCA1–BARD1. Top, quantitation of DNA degradation (based on the proportion of degradation products of ≤300 bp in length). Averages shown; error bars, s.e.m.; n = 3. **P = 0.0012, two-tailed t-test. Bottom, representative assays. Source data are provided in Supplementary Fig. 3. Source Data
Fig. 5
Fig. 5. BRCA1–BARD1 promotes resection by EXO1 independently of CtIP.
a, Representative kinetic resection assays with EXO1, RPA, in the absence or presence of BRCA1–BARD1. Top, a schematic of the assay. Red asterisks (*) represent the position of the radioactive labels. b, Quantitation of DNA degradation from assays such as shown in a. Averages shown; error bars, s.e.m.; n = 3. c, Cartoon of the primary structure of the EXO1 protein and the Δ1 variant used in the study. d, Resection assays with RPA, wild-type EXO1 or EXO1 Δ1, in the absence or presence of BRCA1–BARD1. Top, quantitation of DNA degradation. Averages shown; error bars, s.e.m.; n = 3. Bottom, representative assays. e, Representative protein-interaction assays. Top, a schematic of the assay. f, Quantitation of clonogenic cell survival of RPE1 cells EXO1+/+ or EXO1−/− cells, which were lentivirally transduced with wild-type or S327A CtIP variants, and in which the endogenous CtIP was disrupted by Cas9–gRNA. Averages shown; error bars, s.e.m.; n = 4. *P = 0.0274, two-tailed t-test. g, Quantitation of RPA+ cells from an experiment such as shown in Extended Data Fig. 8k. Values were normalized against the DMSO-treated cells. Averages shown; error bars, s.d.; n = 3. DMSO- versus DNA2i-treated GFP cells *P = 0.012, DMSO- versus DNA2i-treated GFP-CtIP-WT cells **P = 0.0094, DNA2i-treated GFP cells versus cells DNA2i-treated GFP-CtIP-WT *P = 0.041, two-tailed t-test. In all cases, at least 150 cells were studied per condition. Source data are provided in Supplementary Fig. 3. Source Data
Fig. 6
Fig. 6. BRCA1–BARD1 enhances RAD51-mediated DNA protection.
a, DNA protection assays with WRN-DNA2-RPA, in the absence or presence of BRCA1–BARD1 and RAD51, performed at 100 mM NaCl. Top, a schematic of the assay. Red asterisks (*) represent the position of the radioactive labels. Middle, quantitation of DNA degradation. Averages shown; error bars, s.e.m.; n = 7 (in the absence of BRCA1–BARD1) and n = 4 (in the presence of BRCA1–BARD1). Bottom, representative assays. b, Representative protection assays with WRN-DNA2-pCtIP-RPA, in the absence or presence of BRCA1–BARD1 and increasing concentration of RAD51. c, Quantitation of DNA protection assays such as shown in b. Averages shown; error bars, s.e.m.; n = 4. The data were normalized to the corresponding reaction without RAD51 (lane 2). Values without normalization are plotted in Extended Data Fig. 9g. Representative protection assays with WRN (10 nM) and DNA2 (10 nM), in presence of pCtIP and BRCA1–BARD1, not shown. d, Quantitation of DNA protection assays such as shown in Extended Data Fig. 9h. Averages shown; error bars, s.e.m.; n = 3. The data were normalized to the corresponding reaction without RAD51 (lane 2). Values without normalization are plotted in Extended Data Fig. 9i. e, Representative protection assays with WRN (25 nM), DNA2 (25 nM), pCtIP (20 nM) and RPA (215 nM), in the absence or presence of BRCA1–BARD1 and either human RAD51 (HsRAD51) or yeast Rad51 (ScRad51). Top, quantitation of DNA degradation. Averages shown; error bars, s.e.m.; n = 5 for reactions containing HsRAD51, in the presence or absence of BRCA1–BARD1 and n = 3 for reactions containing ScRAD51, in the presence or absence of BRCA1–BARD1. ****P ≤ 0.0001, two-tailed t-test. Source data are provided in Supplementary Fig. 3. Source Data
Extended Data Fig. 1
Extended Data Fig. 1. BRCA1–BARD1 stimulates long-range resection by WRN-DNA2-RPA.
a, Molecular weight distributions of 2xMBP-tagged BRCA1 alone or in complex with BARD1 measured by mass photometry. Black asterisks (*) indicate background noise. b, Polyacrylamide gels of the indicated recombinant proteins stained with Coomassie Brilliant Blue. c, DNA endonuclease assays with MRN-pCtIP, in the absence or presence of BRCA1-BARD1. Top, a schematic of the assay. Red asterisk (*) represents the position of the radioactive label. Middle, quantitation of DNA degradation. Averages shown; error bars, SEM; n = 3. Bottom, representative assays. d, DNA exonuclease assays with MR, in the absence or presence of either BRCA1 or BRCA1-BARD1. Right, a schematic of the substrate. Red asterisk (*) represents the position of the radioactive label. Top left, quantitation of the different reaction intermediates. Averages shown; error bars, SEM; n = 3. Bottom, representative assays. e, Representative kinetic resection assays with WRN-DNA2-RPA, in the absence or presence of BRCA1-BARD1. f, Representative resection assays with RPA and the indicated concentrations of WRN in the absence or presence of BRCA1-BARD1 and DNA2. For this assay 0.2 nM of radioactively labeled substrate was used. g, 2xMBP-BRCA1-BARD1 either mock-treated or treated with PreScission protease (1:5 ratio, w:w) for 1 h at 4 °C. The polyacrylamide gel was stained with Coomassie Brilliant Blue. h, Representative resection assays on with WRN-DNA2-RPA, in the absence or presence of BRCA1-BARD1, either mock- or PreScission protease-treated. i, Polyacrylamide gels of the indicated recombinant WRN and DNA2 variants stained with Coomassie Brilliant Blue. j, Representative resection assays with wild type WRN or helicase-dead WRN K577M, wild type DNA2, helicase-dead DNA2 K654R or nuclease-dead DNA2 D277A, RPA, in the absence or presence of BRCA1-BARD1. ATP was omitted or substituted with non-hydrolysable ATP analogs (ATP-γ-S or AMP-PNP) as indicated. Source data are provided as Supplementary Information SI Fig. 4. Source Data
Extended Data Fig. 2
Extended Data Fig. 2. BRCA1-BARD1 stimulates ATP-dependent WRN helicase.
a, Unwinding assays with WRN-RPA, in the absence or presence of BRCA1-BARD1. Top, a schematic of the assay. Red asterisk (*) represents the position of the radioactive label. Bottom, representative assays. b, Quantitation of DNA unwinding assays such as shown in a. Averages shown; error bars, SEM; n = 3. c, Recombinant nuclease-dead yeast Dna2 E675A used in this study. The polyacrylamide gel was stained with Coomassie Brilliant Blue. d, Quantitation of unwinding assays with WRN-RPA or nuclease-dead yeast Dna2 E675A and RPA, in the absence or presence of BRCA1-BARD1. Averages shown; error bars, SEM; n = 3. Top right, a schematic of the assay. Red asterisk (*) represents the position of the radioactive labels. e, ATPase assays with a 93 nt-long ssDNA, WRN and RPA, in the absence or presence of either BRCA1 or BRCA1-BARD1. Top, quantitation of ATP hydrolysis. Averages shown; error bars, SEM (lanes 2-10); n = 2 for BRCA1 and BRCA1-BARD1 alone controls and n = 3 for all the other samples. Bottom, representative assays. f, Representative trajectory of DNA unwinding events by WRN in the presence of RPA, both 25 nM. g, Representative trajectory of DNA unwinding events by WRN (25 nM) in the presence of BRCA1-BARD1 (40 nM) and RPA (25 nM). h, Representative trajectories with the reaction buffer (left) or BRCA1-BARD1 (40 nM) and RPA (25 nM) alone (right). i, Nuclease assays with DNA2-RPA, in the absence or presence of BRCA1-BARD1. Top, a schematic of the assay. Red asterisks (*) represent the position of the radioactive labels. Middle, quantitation of the DNA degradation products. Averages shown; error bars, SEM; n = 3. Bottom, representative assays. j ATPase assays in the presence of 10.3 knt-long ssDNA with wild type DNA2 or nuclease-dead DNA2 D277A and RPA, in the absence or presence of BRCA1-BARD1. Top, quantitation of ATP hydrolysis. Averages shown; error bars, SEM; n = 4. Bottom, representative assays. k, Representative kinetic assays with WRN-DNA2-RPA, phosphorylated CtIP (pCtIP), in the absence or presence of BRCA1-BARD1. l, Quantitation of DNA degradation products from assays such as shown in k. Averages shown; error bars, SEM; n = 3. m, A schematic of the λ DNA/HindIII-based substrate employed for the DNA end resection assays. Shown is the distribution of the DNA fragments in their double-stranded (left) or single-stranded (middle) forms. The right lane shows an example of a pattern upon partial DNA degradation. n, Quantitation of DNA degradation products (based on disappearance of DNA fragments of ≥4.3 kbp in length) from assays such as shown in Fig. 3a. Averages shown; error bars, SEM; n = 3. o, Representative resection assays with wild type WRN or helicase-dead WRN K577M, wild type DNA2, or helicase-dead DNA2 K654R or nuclease-dead DNA2 D277A, pCtIP and RPA, in the absence or presence of BRCA1-BARD1. ATP was omitted or substituted with non-hydrolysable ATP analogs (ATP-γ-S or AMP-PNP) as indicated. Source data are provided as Supplementary Information SI Fig. 5. Source Data
Extended Data Fig. 3
Extended Data Fig. 3. The BRCA1-C complex stimulates resection by WRN-DNA2-RPA.
a, Nuclease assays with DNA2-pCtIP-RPA, in the absence or presence of BRCA1-BARD1. Top, a schematic of the substrate. Middle, quantitation of DNA degradation. Averages shown; error bars, SEM; n = 3. Bottom, representative assays. b, Representative trajectories of DNA unwinding events by nuclease-dead DNA2 D277A (10 nM) with pCtIP (10 nM) and RPA (25 nM), in the absence (green) or presence (pink) of BRCA1-BARD1 (25 nM). c, d, Processivity histogram and cumulative probability distribution (shown as survival probability) of the observed DNA unwinding events by nuclease-dead DNA2 D277A-pCtIP-RPA, in the absence (green) or presence (pink) of BRCA1-BARD1, with mean values of 264 ± 38 bp (n = 55) and 271 ± 32 bp (n = 49), respectively. Error, 2SEM. e, f, Velocity histogram and cumulative probability distribution (shown as survival probability) of the observed DNA unwinding events by nuclease-dead DNA2 D277A-pCtIP-RPA, in the absence (green) or presence (pink) of BRCA1-BARD1, with mean values of 57 ± 8 bp/sec (n = 55) and 46 ± 6 bp/sec (n = 49), respectively. Error, 2SEM. g, Representative resection assays with WRN-DNA2-pCtIP-RPA, BRCA1-BARD1, and the indicated concentration of MRN. Top, quantitation of DNA degradation products (based on disappearance of DNA fragments of ≥4.3 kbp in length). Averages shown; error bars, SEM; n = 3. h, Representative kinetic resection assays with WRN-RPA, in the absence or presence of MRN. i, Quantitation of DNA unwinding assays such as shown in h. Averages shown; error bars, SEM; n = 3. j, Representative trajectories of DNA unwinding events by WRN, in the absence or presence of the indicated proteins, all at 25 nM. k, Polyacrylamide gels of the indicated recombinant proteins stained with Coomassie Brilliant Blue (relevant proteins indicated with red brackets). Black asterisks (*) represent truncations of the indicated proteins (lanes 4 and 5). l, Representative resection assays with DNA2-pCtIP-RPA, in the presence of WRN (WRN) or de-phosphorylated WRN (λWRN), and in the absence or presence of BRCA1-BARD1. Source data are provided as Supplementary Information SI Fig. 6. Source Data
Extended Data Fig. 4
Extended Data Fig. 4. CtIP interaction with BRCA1 and DNA2 is required for its function in the long-range DNA end resection ensemble.
a, Polyacrylamide gels of the indicated recombinant proteins stained with Coomassie Brilliant Blue (relevant proteins indicated with red arrows or red brackets). Black asterisks (*) represent truncations of the indicated proteins (lanes 5, 7), proteins with uncleaved MBP-tag (lanes 9-12) or proteins with some spontaneous cleavage of the MBP-tag (lanes 14-16 and 25). BRCA1 VD-FD, V1035D-F1036D (lane 24). BRCA1 YD-ID, Y1127D-I1129D (lane 25). b, Cartoon of the primary structure of the phosphorylated CtIP (pCtIP) variants used in this study. Deleted portions of the protein are indicated with a diamond grid pattern. The capacity of each variant to stimulate MRN and/or DNA2-mediated resection, as reported from previous studies, is indicated on the right. n.d., not determined. c, Resection assays with WRN-DNA2-RPA, in the absence or presence of BRCA1-BARD1 and the indicated pCtIP variant (see panel b). Top, quantitation of DNA degradation products of 300 bp in length. Averages shown; error bars, SEM; n = 3. Bottom, representative assays. d, Resection assays showing the substrate degradation by DNA2-RPA, in the presence of either wild type pCtIP or pCtIP S327A variant. Top, quantitation of DNA degradation products of 300 bp in length. Averages shown; error bars, SEM; n = 3. Bottom, representative assays. e, Nuclease assays with MRN, in the presence of either wild type pCtIP or pCtIP S327A variants. Left, a schematic of the assay. Red asterisk (*) represents the position of the radioactive label. Right, representative assays. Source data are provided as Supplementary Information SI Fig. 7. Source Data
Extended Data Fig. 5
Extended Data Fig. 5. Identification of BRCA1 regions necessary for DNA end resection.
a, Cartoon of the primary structure of the BRCA1 protein including all variants used in this study. Deleted segments of the proteins are indicated with diamond grid pattern. b, Resection assays with WRN-DNA2-pCtIP-RPA, in the absence or presence of the indicated BRCA1 variants in complex with BARD1. Top, quantitation of DNA degradation. Averages shown; error bars, SEM; n = 3. Bottom, representative assays. c, Resection assays with WRN-DNA2-RPA, in the absence or presence of the indicated BRCA1 variants in complex with BARD1. Top, quantitation of DNA degradation. Averages shown; error bars, SEM; n = 3. Bottom, representative assays. d, Resection assays with WRN-DNA2-RPA, in absence or presence of pCtIP and the indicated BRCA1-BARD1 variants. Top, quantitation of DNA degradation products of 300 bp in length. Averages shown; error bars, SEM; n = 3. Bottom, representative assays. e, Unwinding assays with WRN-RPA, in the absence or presence of the indicated BRCA1-BARD1 variants. Averages shown; error bars, SEM; n = 3. Top, a schematic of the substrate. Red asterisk (*) represents the position of the radioactive label. f, Alignment of BRCA1 region 931-1171. Selected residues mutated in this study are highlighted by pink triangles. Insertions in the orthologs of human BRCA1 are not shown. g, Representative resection assays with WRN-DNA2-pCtIP-RPA, in the absence or presence of the indicated BRCA1 variants in complex with BARD1. Source data are provided as Supplementary Information SI Fig. 8. Source Data
Extended Data Fig. 6
Extended Data Fig. 6. Identification of BARD1 and WRN regions necessary for DNA end resection.
a, Cartoon of the primary structure of BARD1 and the truncated variants used in this study. b, Polyacrylamide gels of the indicated BARD1 variants stained with Coomassie Brilliant Blue. c, Representative kinetic resection assays with WRN-DNA2-pCtIP-RPA, in the absence or presence of either BRCA1-BARD1 or BRCA1. d, Quantitation of DNA degradation from assays such as shown in c. Averages shown; error bars, SEM; n = 3. e, Resection assays with WRN-DNA2-pCtIP-RPA, in the absence or presence of the indicated BARD1 variants in complex with BRCA1. Top, quantitation of DNA degradation. Averages shown; error bars, SEM; n = 3. Bottom, representative assays. f, Alignment of the BARD1 region 123-261. Selected patches and residues mutated in this study are highlighted. Insertions in the orthologs of human BARD1 are not shown. g, Resection assays with WRN-DNA2-pCtIP-RPA, in the absence or presence of the indicated BARD1 variant, expressed as BRCA1-BARD1. Top, quantitation of DNA degradation. Averages shown; error bars, SEM; n = 3. Bottom, representative assays. h, Cartoon of the primary structure of the WRN protein and the truncated variants used in this study. i, Polyacrylamide gels of the indicated recombinant proteins stained with Coomassie Brilliant Blue (relevant proteins indicated with red arrows). j, Representative resection assays with DNA2-pCtIP-RPA and the indicated WRN variant, in the absence or presence of BRCA1-BARD1. k, Quantitation of DNA degradation product from resection assays such as shown in i. Averages shown; error bars, SEM; n = 3. Source data are provided as Supplementary Information SI Fig. 8. Source Data
Extended Data Fig. 7
Extended Data Fig. 7. BRCA1 interacts with WRN through multiple contact points.
a, Quantitation of DNA degradation products from resection assays with DNA2- RPA, in the absence or presence of BRCA1-BARD1 and the indicated WRN variant. Averages shown; error bars, SEM; n = 3. b, Representative resection assays with DNA2-pCtIP-RPA, the indicated WRN variant and BRCA1-BARD1. FL, full-length WRN protein. c, Quantitation of DNA degradation from assays such as shown in b. Averages shown; error bars, SEM; n = 5. d, Representative trajectories of DNA unwinding events by the indicated WRN variant, in the absence or presence of BRCA1-BARD1, all at 25 nM. FL, full-length WRN protein. e, ∆DNA-length analysis of the indicated WRN variants, in the absence or presence of BRCA1-BARD1, at 25 nM. Averages shown; error bars, SEM; n = 8 (for WRN WT, WRN F2, WRN F2 + BRCA1-BARD1), n = 6 (for WRN WT + BRCA1-BARD1, WRN F1), n = 5 (for WRN F5, WRN F5 + BRCA1-BARD1, WRN F6 + BRCA1-BARD1), n = 2 (for WRN F1 + BRCA1-BARD1, WRN F4, WRN F4 + BRCA1-BARD1, WRN F6), n = 3 (WRN F3, WRN F3 + BRCA1-BARD1). f, Representative protein interaction assays. g, A model of DNA2-dependent DNA end resection pathway and its stimulation by the BRCA1-C complex. Source data are provided as Supplementary Information SI Fig. 9. Source Data
Extended Data Fig. 8
Extended Data Fig. 8. Stimulation of EXO1-dependent long-range DNA end resection by BRCA1-BARD1.
a, Polyacrylamide gels of the indicated recombinant EXO1 variants stained with Coomassie Brilliant Blue. b, Resection assays with the indicated EXO1 variant and RPA, in the absence or presence of either BRCA1 or BRCA1-BARD1. Top, quantitation of DNA degradation. Averages shown; error bars, SEM; n = 4. Bottom, representative assays. c, Resection assays with EXO1, in the absence or presence of the indicated BRCA1-BARD1 variant. Top, quantitation of DNA degradation. Averages shown; error bars, SEM; n = 3. Bottom, representative assays. d, Resection assays with EXO1 and RPA, in the absence or presence of either BRCA1 or BRCA1-BARD1 and pCtIP. Top, quantitation of DNA degradation. Averages shown; error bars, SEM; n = 3. Bottom, representative assays. e, Representative kinetic resection assays with a randomly labeled 2.2 kbp-long dsDNA, EXO1 and RPA, in the absence or presence of BRCA1-BARD1 and pCtIP. f, Quantitation of DNA resection assays such as shown in e. Averages shown; error bars, SEM; n = 3. g, Representative assays with the indicated EXO1 variant and RPA. h, Representative resection assays with E. coli ExoIII and RPA, in the absence or presence of either BRCA1 or BRCA1-BARD1. i, A model of EXO1-dependent DNA end resection pathway and the involvement of BRCA1-BARD1. j, Western Blot analysis showing expression of lentivirally transduced FLAG-tagged CtIP WT or S327A in RPE1 EXO1+/+ or EXO1−/− cells. k, Representative microscopy images of indicated U2OS-derived cell lines untreated (DMSO) or treated (DNA2i) with the DNA2 inhibitor C5, stained for RPA (red) or DAPI (blue). Scale bar, 10 μm. l, Quantitation of the cell cycle distribution of the indicated cell lines untreated (DMSO) or treated (DNA2i) with the DNA2 inhibitor C5. Source data are provided as Supplementary Information SI Figs. 9 and 10. Source Data
Extended Data Fig. 9
Extended Data Fig. 9. DNA protection by RAD51-BRCA1-BARD1 ensemble.
a, Polyacrylamide gels of the indicated recombinant RAD51 variants stained with Coomassie Brilliant Blue. b, DNA protection assays with WRN-DNA2-pCtIP-RPA, in the absence or presence of BRCA1-BARD1 and RAD51, performed at 100 mM NaCl. Top, a schematic of the assay. Red asterisks (*) represent the position of the radioactive labels. Middle, quantitation of DNA degradation. Averages shown; error bars, SEM; n = 3. Bottom, representative assays. c, Quantitation of kinetic protection assays with WRN-DNA2-RPA, in the absence or presence of BRCA1-BARD1 and RAD51, performed at 100 mM NaCl. Averages shown; error bars, SEM; n = 2 (for DNA2-WRN), n = 7 (in the absence of BRCA1-BARD1) and n = 4 (in the presence of BRCA1). d, Protection assays with WRN-DNA2-RPA, in the absence or presence of BRCA1 and RAD51, performed at 100 mM NaCl. Top, a schematic of the assay. Red asterisks (*) represent the position of the radioactive labels. Middle, quantitation of DNA degradation. Averages shown; error bars, SEM; n = 7 (in the absence of BRCA1) and n = 4 (in the presence of BRCA1). Bottom, representative assays. e, Quantitation of kinetic protection assays with WRN-DNA2-RPA, in the absence or presence of BRCA1 and RAD51, performed at 100 mM NaCl. Quantitation of DNA degradation by WRN-DNA2, in the absence or presence of RAD51, such as shown in b is included as a reference. Averages shown; error bars, SEM; n = 2 (for DNA2-WRN), n = 7 (in the absence of BRCA1-BARD1) and n = 4 (in the presence of BRCA1). f, Protection assays with WRN-DNA2-RPA, in the absence or presence of BRCA1-BARD1 and the indicated RAD51 variant, performed at 100 mM NaCl. KR, K133R, defective in ATP hydrolysis; KA, K133A, defective in ATP binding; TP, T131P, impaired in DNA binding. Top, quantitation of DNA protection. Averages shown; error bars, SEM; n = 3. Bottom, representative assays. g, Quantitation of assays such as shown in Fig. 6b. Averages shown; error bars, SEM; n = 3. The quantitation was not normalized. Representative assays with WRN (10 nM) and DNA2 (10 nM), in presence of pCtIP and BRCA1-BARD1, not shown. h, Representative protection assays with EXO1-RPA, in the absence or presence of BRCA1-BARD1 and increasing concentration of RAD51. i, Quantitation of assays such as shown in h. Averages shown; error bars, SEM; n = 3. The quantitation was not normalized. Source data are provided as Supplementary Information SI Fig. 11. Source Data
Extended Data Fig. 10
Extended Data Fig. 10. BRCA1-BARD1 does not affect DNA degradation by non-cognate nucleases.
a, Representative protection assays with DNA2-RPA, in the absence or presence of BRCA1-BARD1 and increasing concentration of RAD51. b, Representative protection assays with the endonucleases ScaI and SspI, with RPA and increasing concentration of human RAD51 (HsRAD51) or yeast Rad51 (ScRad51) in the absence or presence of BRCA1-BARD1 c, Quantitation of assays such as shown in b (left). Averages shown; error bars, SEM; n = 3. d, Quantitation of assays such as shown in b (right). Averages shown; error bars, SEM; n = 3. e, Representative protection assays with E. coli ExoIII, with RPA and increasing concentrations of human RAD51 (HsRAD51) or yeast Rad51 (ScRad51) in the absence or presence of BRCA1-BARD1. f, A model for DNA protection function of BRCA1-BARD1 in the presence of RAD51 upon replication stress. RAD51 inhibits DNA degradation by nucleases in an unspecific manner via its binding to dsDNA. Additionally, as shown here, RAD51, together with BRCA1-BARD1, inhibits specifically DNA2-dependent long-range resection. Source data are provided as Supplementary Information SI Fig. 11. Source Data

Similar articles

Cited by

  • Promotion of DNA end resection by BRCA1-BARD1 in homologous recombination.
    Salunkhe S, Daley JM, Kaur H, Tomimatsu N, Xue C, Raina VB, Jasper AM, Rogers CM, Li W, Zhou S, Mojidra R, Kwon Y, Fang Q, Ji JH, Badamchi Shabestari A, Fitzgerald O, Dinh H, Mukherjee B, Habib AA, Hromas R, Mazin AV, Wasmuth EV, Olsen SK, Libich DS, Zhou D, Zhao W, Greene EC, Burma S, Sung P. Salunkhe S, et al. Nature. 2024 Oct;634(8033):482-491. doi: 10.1038/s41586-024-07910-2. Epub 2024 Sep 11. Nature. 2024. PMID: 39261729

References

    1. Cejka, P. & Symington, L. S. DNA end resection: mechanism and control. Annu. Rev. Genet.55, 285–307 (2021). - PubMed
    1. Kawale, A. S. & Sung, P. Mechanism and significance of chromosome damage repair by homologous recombination. Essays Biochem. 10.1042/EBC20190093 (2020). - PubMed
    1. Prakash, R., Zhang, Y., Feng, W. & Jasin, M. Homologous recombination and human health: the roles of BRCA1, BRCA2, and associated proteins. Cold Spring Harb. Perspect. Biol.7, a016600 (2015). - PMC - PubMed
    1. Schlacher, K., Wu, H. & Jasin, M. A distinct replication fork protection pathway connects Fanconi anemia tumor suppressors to RAD51-BRCA1/2. Cancer Cell22, 106–116 (2012). - PMC - PubMed
    1. Schlacher, K. et al. Double-strand break repair-independent role for BRCA2 in blocking stalled replication fork degradation by MRE11. Cell145, 529–542 (2011). - PMC - PubMed

MeSH terms

Substances

LinkOut - more resources