

Bruton Tyrosine Kinase Inhibition Decreases Inflammation and Differentially Impacts Phagocytosis and Cellular Metabolism in Mouse- and Human-derived Myeloid Cells
- PMID: 39259208
- PMCID: PMC11447691
- DOI: 10.4049/immunohorizons.2400045
Bruton Tyrosine Kinase Inhibition Decreases Inflammation and Differentially Impacts Phagocytosis and Cellular Metabolism in Mouse- and Human-derived Myeloid Cells
Abstract
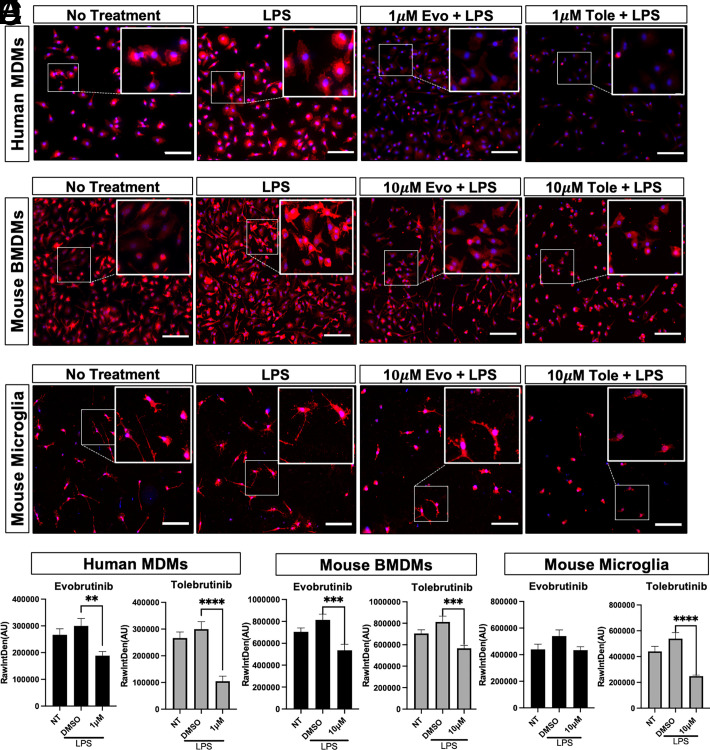
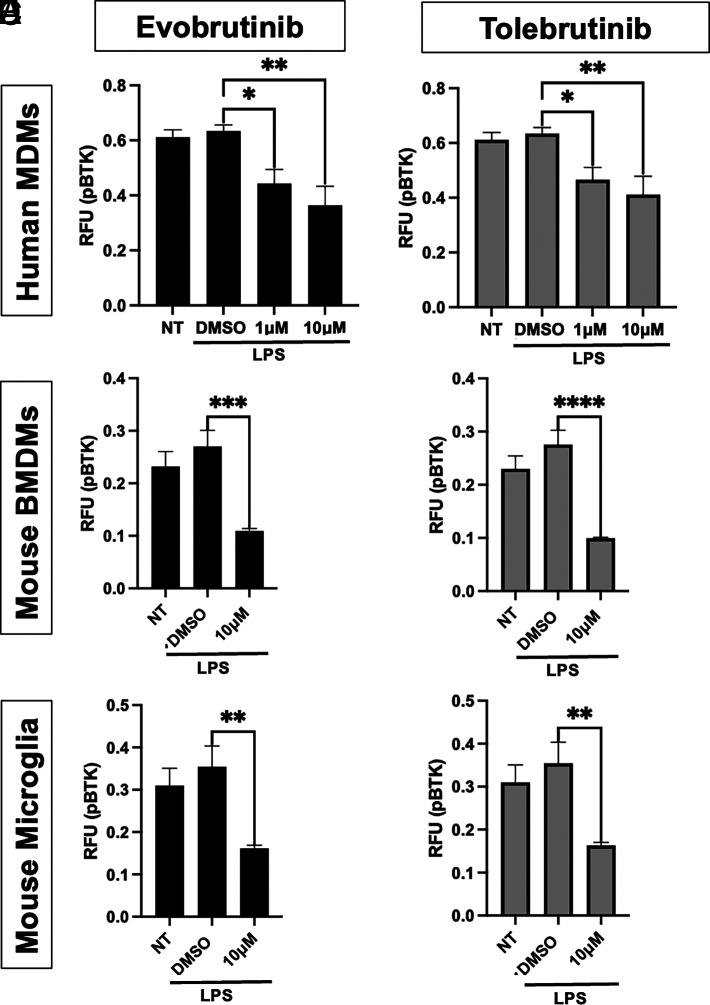
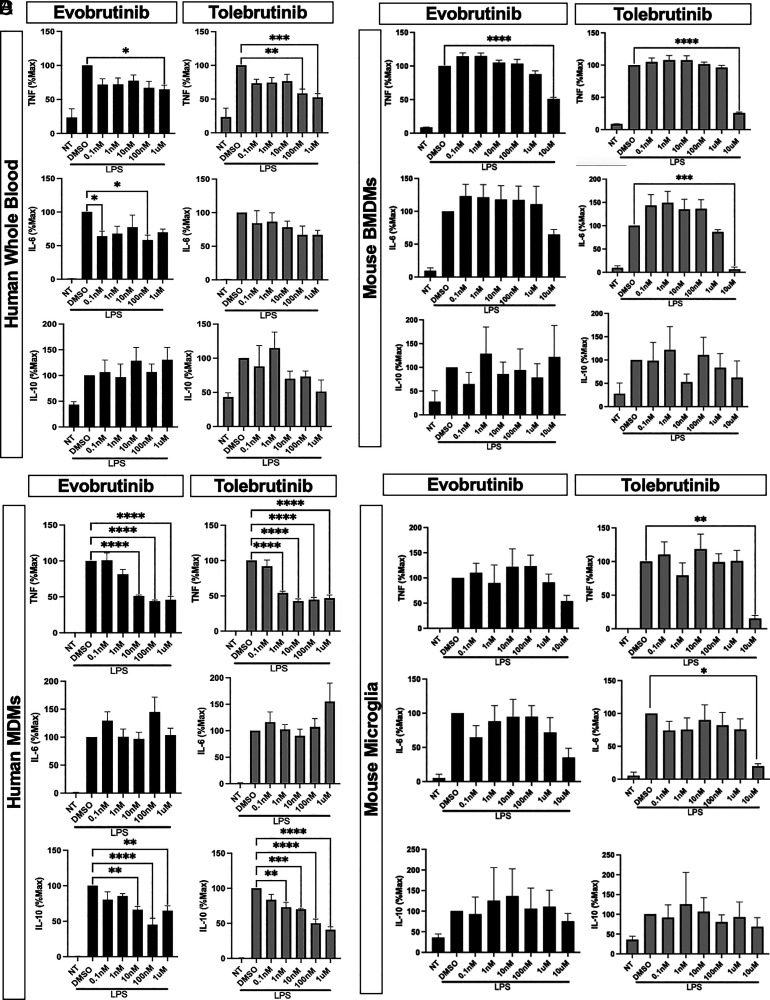
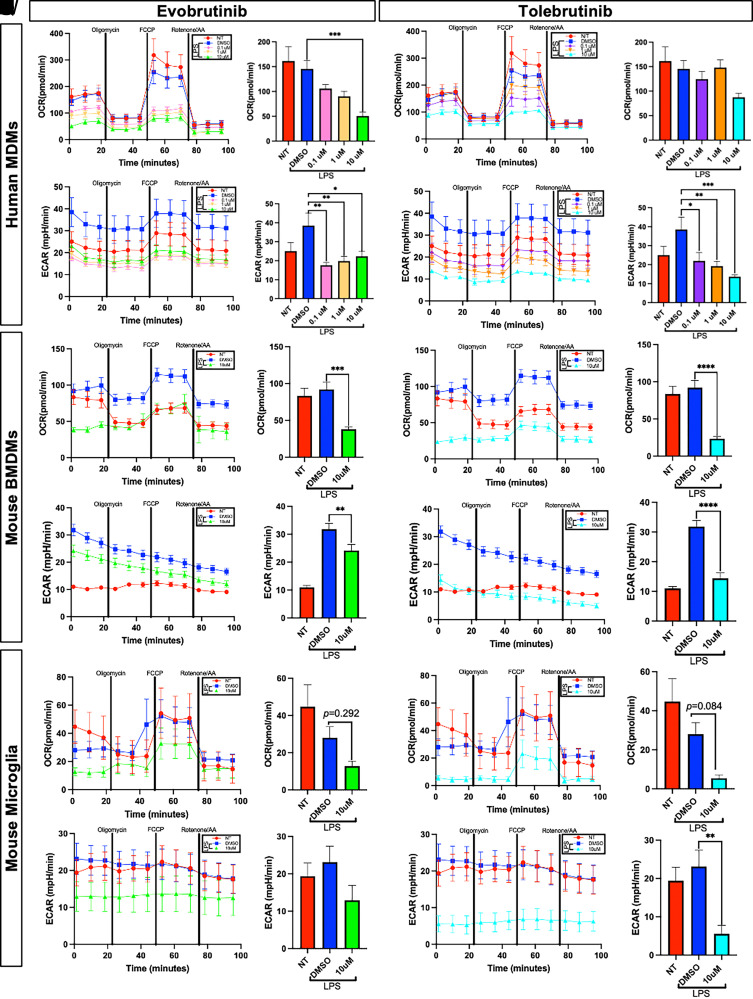
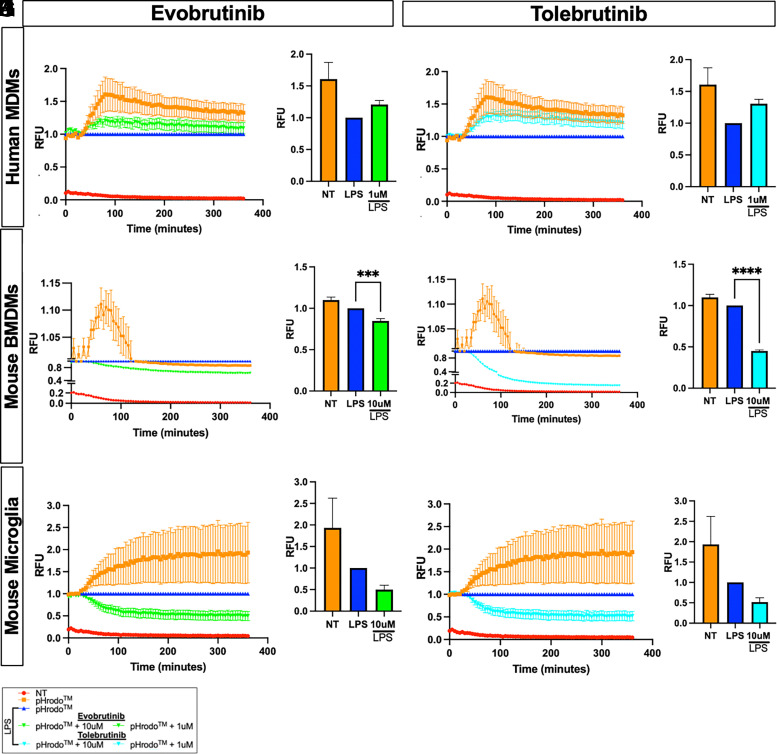
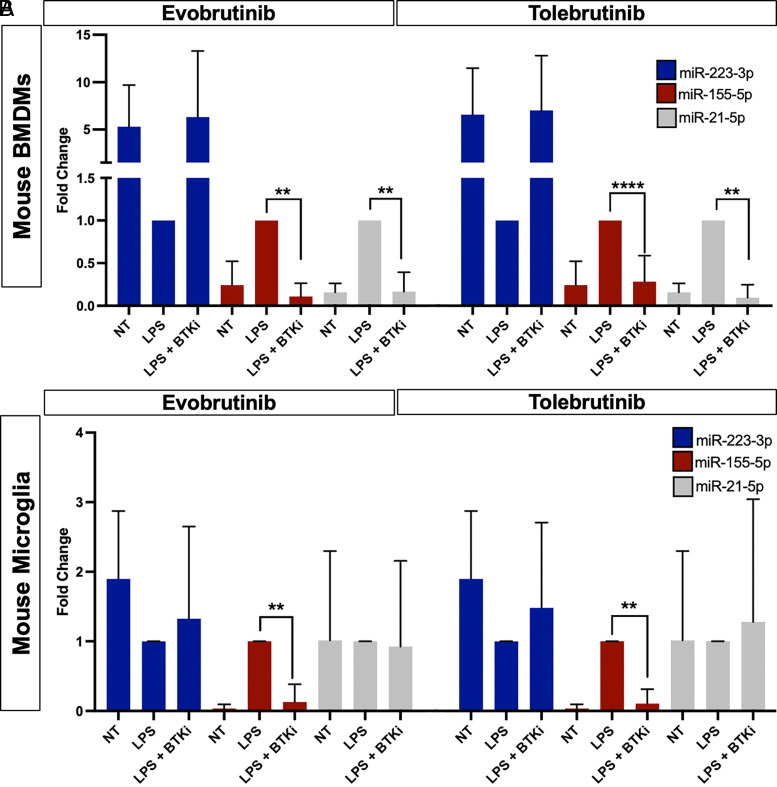
Bruton tyrosine kinase (BTK) is a kinase expressed by various immune cells and is often activated under proinflammatory states. Although the majority of BTK-related research has historically focused on B cells, understanding the role of BTK in non-B cell populations is critical given myeloid cells also express BTK at comparable levels. In this study, we investigated and compared how BTK inhibition in human and murine myeloid cells alters cell phenotype and function. All experiments were performed using two BTK inhibitors (evobrutinib and tolebrutinib) that are currently in late-stage clinical trials for the treatment of multiple sclerosis. Assays were performed to assess the impact of BTK inhibition on cytokine and microRNA expression, phagocytic capacity, and cellular metabolism. In all cells, both evobrutinib and tolebrutinib significantly decreased phosphorylated BTK and LPS-induced cytokine release. BTK inhibition also significantly decreased the oxygen consumption rate and extracellular acidification rate in myeloid cells, and significantly decreased phagocytosis in murine-derived cells, but not human macrophages. To further elucidate the mechanism, we also investigated the expression of microRNAs known to impact the function of myeloid cells. BTK inhibition resulted in an altered microRNA expression profile (i.e., decreased miR-155-5p and increased miR-223-3p), which is consistent with a decreased proinflammatory myeloid cell phenotype. In summary, these results provide further insights into the mechanism of action of BTK inhibitors in the context of immune-related diseases, while also highlighting important species-specific and cell-specific differences that should be considered when interpreting and comparing results between preclinical and human studies.
Copyright © 2024 The Authors.
Conflict of interest statement
The authors have no financial conflicts of interest.
Figures
Similar articles
-
Erratum: Eyestalk Ablation to Increase Ovarian Maturation in Mud Crabs.J Vis Exp. 2023 May 26;(195). doi: 10.3791/6561. J Vis Exp. 2023. PMID: 37235796
-
Depressing time: Waiting, melancholia, and the psychoanalytic practice of care.In: Kirtsoglou E, Simpson B, editors. The Time of Anthropology: Studies of Contemporary Chronopolitics. Abingdon: Routledge; 2020. Chapter 5. In: Kirtsoglou E, Simpson B, editors. The Time of Anthropology: Studies of Contemporary Chronopolitics. Abingdon: Routledge; 2020. Chapter 5. PMID: 36137063 Free Books & Documents. Review.
-
Inhibition of Bruton's tyrosine kinase restricts neuroinflammation following intracerebral hemorrhage.Theranostics. 2025 Jan 1;15(2):494-508. doi: 10.7150/thno.101024. eCollection 2025. Theranostics. 2025. PMID: 39744694 Free PMC article.
-
Defining the optimum strategy for identifying adults and children with coeliac disease: systematic review and economic modelling.Health Technol Assess. 2022 Oct;26(44):1-310. doi: 10.3310/ZUCE8371. Health Technol Assess. 2022. PMID: 36321689 Free PMC article.
-
Impact of residual disease as a prognostic factor for survival in women with advanced epithelial ovarian cancer after primary surgery.Cochrane Database Syst Rev. 2022 Sep 26;9(9):CD015048. doi: 10.1002/14651858.CD015048.pub2. Cochrane Database Syst Rev. 2022. PMID: 36161421 Free PMC article. Review.
References
-
- Marcotte, D. J., Liu Y., Arduini R. M., Hession C. A., Miatkowski K., Wildes C. P., Cullen P. F., Hong V., Hopkins B. T., Mertsching E., et al. . 2010. Structures of human Bruton’s tyrosine kinase in active and inactive conformations suggest a mechanism of activation for TEC family kinases. Protein Sci. 19: 429–439. - PMC - PubMed
-
- Simonowski, A., Wilhelm T., Habib P., Zorn C. N., Huber M.. 2020. Differential use of BTK and PLC in FcϵRI- and KIT-mediated mast cell activation: a marginal role of BTK upon KIT activation. Biochim. Biophys. Acta Mol. Cell. Res. 1867: 118622. - PubMed
-
- Horwood, N. J., Page T. H., McDaid J. P., Palmer C. D., Campbell J., Mahon T., Brennan F. M., Webster D., Foxwell B. M. J.. 2006. Bruton’s tyrosine kinase is required for TLR2 and TLR4-induced TNF, but not IL-6, production. J. Immunol. 176: 3635–3641. - PubMed
-
- Doyle, S. L., Jefferies C. A., Feighery C., O’Neill L. A.. 2007. Signaling by Toll-like receptors 8 and 9 requires Bruton's tyrosine kinase. J. Biol. Chem. 282: 36953–36960. - PubMed
MeSH terms
Substances
LinkOut - more resources
Full Text Sources