[Preprint]. 2024 Aug 30:2024.08.29.610280.
doi: 10.1101/2024.08.29.610280.

Centromeric transposable elements and epigenetic status drive karyotypic variation in the eastern hoolock gibbon

Affiliations

Centromeric transposable elements and epigenetic status drive karyotypic variation in the eastern hoolock gibbon

Gabrielle A Hartley et al. bioRxiv. .

Abstract

Great apes have maintained a stable karyotype with few large-scale rearrangements; in contrast, gibbons have undergone a high rate of chromosomal rearrangements coincident with rapid centromere turnover. Here we characterize assembled centromeres in the Eastern hoolock gibbon, Hoolock leuconedys (HLE), finding a diverse group of transposable elements (TEs) that differ from the canonical alpha satellites found across centromeres of other apes. We find that HLE centromeres contain a CpG methylation centromere dip region, providing evidence this epigenetic feature is conserved in the absence of satellite arrays; nevertheless, we report a variety of atypical centromeric features, including protein-coding genes and mismatched replication timing. Further, large structural variations define HLE centromeres and distinguish them from other gibbons. Combined with differentially methylated TEs, topologically associated domain boundaries, and segmental duplications at chromosomal breakpoints, we propose that a "perfect storm" of multiple genomic attributes with propensities for chromosome instability shaped gibbon centromere evolution.

Keywords: centromeres; chromosome evolution; genome assembly; gibbons; methylation; primate genomics; replication timing; transposable elements.


Conflict of interest statement

Declaration of Interests R.J.O. serves on the SAB of Colossal Biosciences and has been supported to present at ONT events.

Figures
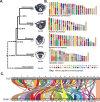
Figure 1:
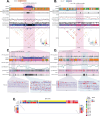
Figure 1:. Gibbon genera display high rates of karyotype variation since their radiation ~8 million years ago.
(A) The phylogeny of lesser apes with estimated divergence times is depicted based on . The four gibbon genera (Hylobates, Hoolock, Symphalangus, and Nomascus) descended from a shared common ancestor ~8 million years ago and now present with highly derivative karyotypes (ranging from 2n=38 to 52). The number below each branch represents the number of known species within each genus. (B) Synteny between human and gibbon chromosomes is shown with a representative species from each gibbon genus, based on . Each color represents homology to a different human autosome, with a key depicted below. (C) Synteny between our assembled HLE chromosomes (top) and human T2T-CHM13 chromosomes (bottom) agree with those demonstrated in (B), confirming lack of large-scale structural mis-assemblies and highlights the genome-wide chromosome rearrangements present in the HLE genome.
Figure 2:
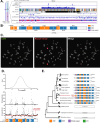
Figure 2:. Centromeres of the Eastern hoolock gibbon are enriched with diverse transposable elements and vary in repeat organization, yet maintain a CDR.
The percentage of total repeat content (bp) classified as each repeat class is shown for (A) the centromere region (defined as the CENP-A domain and 500kb upstream and downstream) and (B) for the CENP-A enrichment domain of the six assembled HLE centromeres, highlighting the highly variable repeat composition of centromeres. Below, chromosome ideograms show the position of HLE Cen9 (C) and Cen11 (D) with chromosomes colored by their synteny to human chromosomes as per Figure 1. From top to bottom, genome tracks denote CENP-A CUT&RUN enrichment (blue), repeat annotations colored according to the key below, synteny to T2T-CHM13, and predicted HLE-CHM13 synteny breakpoints. Fiber-seq inferred regulatory element (FIRE) tracks show FIRE density binned per 1kb on a heatmap scale from white to black (i.e. low to high density), showing increased density of FIREs correlating with CENP-A enrichment corresponding to dichromatin organization. Gene tracks (blue and tan bars indicating true and falsely predicted exons, respectively) show gene predictions from FLAG, showing the presence of several genes nearby and overlapping with CENP-A enrichment. Replication timing from E/L Repli-seq is shown as black points indicating the log ratio of early-to-late coverage over 5kb windows from 4 (early replication) to −4 (late replication), with a red line indicating the 10 point moving average. CpG methylation is shown via line plot (black line) and on a heatmap scale from low CpG methylation (black) to high CpG methylation (red). In HLE, CENP-A enrichment is associated with a dip in CpG methylation (CDRs) even in the absence of alpha satellite-containing centromeres and despite significant changes in CG density (purple). Finally, sequence identity plots are shown for each assembled centromere, with a scale from blue (low identity) to red (high identity). Overall, regions of CENP-A enrichment share little sequence identity compared to canonical and pericentromeric primate alpha satellite arrays.
Figure 3:
Figure 3:. A latent alpha satellite centromere on HLE chromosome 17 lost epigenetic signatures of centromere function.
Chromosome ideograms show the position of HLE CenX (A) flanked by dense LINE-rich regions and a latent centromere on Chr 17 (B) with chromosomes colored by their synteny to human chromosomes as per Figure 1. Genome tracks denote CENP-A CUT&RUN enrichment (blue), repeat annotations with each repeat class represented by a different color, synteny to T2T-CHM13, predicted breakpoints, FIRE elements, genes, replication timing, CpG methylation, CG percentage, and sequence identity, per the key in Figure 2. Zoomed panels for CenX (C) and Chr 17 (D) highlight the repeat organization of the two alpha satellite arrays, which present with LINE (CenX and Chr 17), Alu (CenX), and LAVA (Chr 17) insertions. Tracks show the presence of a CpG methylation dip region over the functional CenX, which is absent in the highly methylated latent alpha satellite centromere on Chr 17. Below, red boxes within FIRE tracks show the presence of disorganized FIRE elements/open chromatin (C, blue inset) in the active CenX corresponding to dichromatin, which is absent in the surrounding heterochromatin (C, purple inset) and the latent centromere on Chr 17 (D, purple inset). The LAVA element on Chr 17 (yellow) is more accessible than the surrounding alpha satellites (D, blue inset), suggesting it is functional. (E) The panel shows a dot-plot (Gepard, word length 50) comparing the HLE CenX (HLE_Chr_X:56370779–56477597) sequenced assembled herein to the SSY gibbon CenX (mSymSyn1_v2.0 chrX_hap1:70,696,431–71,324,358) described previously. Corresponding alpha satellite annotation tracks are shown for both centromeres, showing alpha satellite super families (SFs) and the strand orientation (blue and red). A deletion breakpoint coincides with the only AS strand switch point in the HLE CenX, and is shown in the HLE_Chr_X:56442082–56442094 window. Breaks in the diagonals on both sides represent small deletions in SSY relative to the HLE-SSY common ancestor. UCSC Browser annotation tracks are described in and represent alpha satellite super family annotation (upper/left panels) and alpha satellite strand annotation (bottom/right panels).
Figure 4:
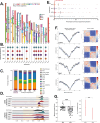
Figure 4:. HLE Cen17 is defined by a unique composite repeat duplication not found in other apes.
(A) To the left, HLE chromosome 17 is depicted with colors indicating synteny to T2T-CHM13. CENP-A CUT&RUN enrichment is shown vertically along the entire chromosome (blue). A zoomed panel shows CENP-A CUT&RUN mapping filtered by reads overlapping with unique 21-mers in the HLE assembly, and total unfiltered CENP-A peaks. Below, a repeat track shows the L5A5 composite repeat assembled in tandem 24 times. FIRE element density, genes, and CpG methylation, and GC percentage is shown according to the key in Figure 2. (B) The 3,319 bp consensus sequence of the L5A5 repeat is shown. (C) DNA FISH on HLE metaphase spreads using a Dig-labeled oligo specific to the L5A5 repeat shows centromeric hybridization on one chromosome pair (green). Human chromosome 20 whole chromosome paint (red) hybridizes to the same chromosome as L5A5, confirming the location of L5A5 to HLE chromosome 17, a chromosome which shares synteny to human chromosome 202. (D) On top, distribution of 21-mer counts from PCR-free Illumina data is shown as 21-mer multiplicity (the number of times a 21-mer was found in the PCR-free Illumina reads) versus the number of 21-mers found at that multiplicity. The chart peaks at 46X, representing the estimated PCR-Free Illumina sequencing depth. Below, the L5A5 copy number is estimated. Along the x-axis, the L5A5 consensus sequence is shown, and the y-axis represents the estimated number of L5A5 repeats in the HLE diploid genome. A horizontal line represents the median of ~1,154 copies in the HLE diploid genome (~577 per haplotype). (E) A phylogeny of the L5A5 repeat across 14 primates is shown. The L5A5 repeat was found in all great apes, gibbons, and the golden snub-nosed monkey, but not in marmoset, tarsier, or lemur genomes. While the L5A5 repeat subunit structure is relatively conserved among gibbons, a SINE/AluSx and LINE/L1ME1 deletion shortened the consensus in great apes by ~700 bp. HLE is the only species with an arrayed L5A5 centromeric structure; all other species have only one L5A5 copy identified.
Figure 5:
Figure 5:. HLE breaks of synteny (BOS) exhibit distinct genetic and epigenetic features.
(A) An ideogram of the assembled HLE chromosomes is shown, with colors corresponding to synteny between human chromosomes (T2T-CHM13) according to the key. To the right of each chromosome, circle markers indicate location of HLE BOS respective to the T2T-CHM13, NLE, HMO, and SSY genome assemblies in differing colors. (B) An upset plot shows BOS found at each HLE centromere. (C) The percentage of total repeats in the overall HLE assembly, and at BOS respective to T2T-CHM13, NLE, HMO, and SSY are shown, with each repeat class represented in a different color. SINEs, LAVAs, SST1s, and simple/low-complexity repeats are prevalent in BOS regions, while LINEs appear depleted. (D) Aggregated CpG methylation across LINE/L1Hylobs and LAVAs are depicted as ridgeplots, showing repeats annotated within BOS respective to CHM13, HMO, NLE, and SSY, as well as repeats outside BOS. Both L1Hylobs and LAVAs are less methylated in BOS on average (highlighted in yellow) with few exceptions. Specifically, LAVAs in HLE-NLE and HLE-SSY BOS and L1Hylobs in HLE-HMO BOS show significant shifts towards lower CpG methylation (p<0.0001). (E) Percentage of BOS covered by segmental duplications is shown, with one dot corresponding to each BOS and black lines indicating the average percentage of bases covered in each category (including BOS with no coverage). The vertical red line at 0.0071 indicates the coverage of segmental duplications genome-wide. (F) Dot plots (black) and loess smoothed curves (blue), show dips in median insulation scores at BOS. Heatmaps show reduction in the frequency of genomic interactions around BOS on a scale from low (blue) to high (red). (G) A dot plot of minimum insulation score (left) shows that older BOS (HyA) are more insulated (lower insulation score) than younger (HLE) BOS (p<0.0001). On the right, the marginal effect of BOS age on nucleotide diversity is plotted after controlling for other genomic features associated with nucleotide diversity. Older BOS were found to have significantly lower nucleotide diversity than younger BOS (p<0.0001). Error bars show the standard deviation.

Similar articles

References

    1. Carbone L., Harris R.A., Gnerre S., Veeramah K.R., Lorente-Galdos B., Huddleston J., Meyer T.J., Herrero J., Roos C., Aken B., et al. (2014). Gibbon genome and the fast karyotype evolution of small apes. Nature 513, 195–201. - PMC - PubMed
    1. Capozzi O., Carbone L., Stanyon R.R., Marra A., Yang F., Whelan C.W., de Jong P.J., Rocchi M., and Archidiacono N. (2012). A comprehensive molecular cytogenetic analysis of chromosome rearrangements in gibbons. Genome Res. 22, 2520–2528. - PMC - PubMed
    1. Misceo D., Capozzi O., Roberto R., Dell’oglio M.P., Rocchi M., Stanyon R., and Archidiacono N. (2008). Tracking the complex flow of chromosome rearrangements from the Hominoidea Ancestor to extant Hylobates and Nomascus Gibbons by high-resolution synteny mapping. Genome Res. 18, 1530–1537. - PMC - PubMed
    1. Mittermeier R.A., Wilson D.E., and Rylands A.B. (2013). Handbook of the Mammals of the World: Primates (Lynx Edicions; ).
    1. Thinh V.N., Mootnick A.R., Geissmann T., Li M., Ziegler T., Agil M., Moisson P., Nadler T., Walter L., and Roos C. (2010). Mitochondrial evidence for multiple radiations in the evolutionary history of small apes. BMC Evol. Biol. 10, 74. - PMC - PubMed

Publication types

LinkOut - more resources