. 2024 Sep 10;14(1):21135.
doi: 10.1038/s41598-024-71311-8.

FABP4 deficiency ameliorates alcoholic steatohepatitis in mice via inhibition of p53 signaling pathway

Affiliations

FABP4 deficiency ameliorates alcoholic steatohepatitis in mice via inhibition of p53 signaling pathway

Hao Xing et al. Sci Rep. .

Abstract

Fatty acid-binding protein 4 (FABP4) plays an essential role in metabolism and inflammation. However, the role of FABP4 in alcoholic steatohepatitis (ASH) remains unclear. This study aimed to investigate the function and underlying mechanisms of FABP4 in the progression of ASH. We first obtained alcoholic hepatitis (AH) datasets from the National Center for Biotechnology Information-Gene Expression Omnibus database and conducted bioinformatics analysis to identify critical genes in the FABP family. We then established ASH models of the wild-type (WT) and Fabp4-deficient (Fabp4-/-) mice to investigate the role of FABP4 in ASH. Additionally, we performed transcriptional profiling of mouse liver tissue and analyzed the results using integrative bioinformatics. The FABP4-associated signaling pathway was further verified. FABP4 was upregulated in two AH datasets and was thus identified as a critical biomarker for AH. FABP4 expression was higher in the liver tissues of patients with alcoholic liver disease and ASH mice than in the corresponding control samples. Furthermore, the Fabp4-/- ASH mice showed reduced hepatic lipid deposition and inflammation compared with the WT ASH mice. Mechanistically, Fabp4 may be involved in regulating the p53 and sirtuin-1 signaling pathways, subsequently affecting lipid metabolism and macrophage polarization in the liver of ASH mice. Our results demonstrate that Fabp4 is involved in the progression of ASH and that Fabp4 deficiency may ameliorate ASH. Therefore, FABP4 may be a potential therapeutic target for ASH treatment.

Keywords: Alcoholic steatohepatitis (ASH); Bioinformatics analysis; FABP4; p53.


Conflict of interest statement

The authors declare no competing interests.

Figures
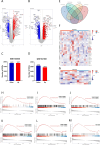
Fig. 1
Fig. 1
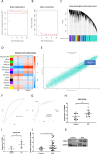
Differential gene expression analysis of the GSE142530 and GSE167308 datasets and single-gene GSEA of FABP4. (A,B) Volcano plots of the DEGs in the GSE142530 (A) and GSE167308 (B) datasets. (C,D) Number of DEGs in the GSE142530 (C) and GSE167308 (D) datasets. (E) Venn diagram of the DEGs in the GSE142530 and GSE167308 datasets. (F,G) Heatmaps of the FABP family-related DEGs in the GSE142530 (F) and GSE167308 (G) datasets. (HM) Single-gene GSEA profiles depicting the six significant GSEA sets in AH. Results are presented as the mean ± SD.
Fig. 2
Fig. 2
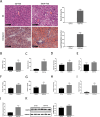
Correlation analysis between Fabp4 expression and AH and verification of Fabp4 expression in ALD patients. (AE) WGCNA of the combined datasets (GSE142530 and GSE167308). (F) AUC of the ROC curve for the FABP4 predictive values in AH. (G) AUCs for FABP4 in AH with RF, SVM, and XGBoost algorithms. (H,I) Fabp4 expression in the GSE142530 (H) and GSE167308 (I) datasets. (JK) Hepatic mRNA (J) and protein (K) levels of FABP4 in ALD patients. Results are presented as the mean ± SD. *P < 0.05.
Fig. 3
Fig. 3
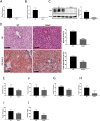
Biochemical, histopathologic, and immunohistochemical analyses of the CD-fed and EtOH-fed WT mouse models. (A) H&E and oil red O staining of the liver tissue sections of the CD-fed and EtOH-fed WT mice (scale bar, 100 μm). (BE) Serum levels of ALT (B), AST (C), TG (D), and TC (E) in the CD-fed and EtOH-fed WT mice. (FI) Hepatic levels of TNF-α (F), IL-6 (G), TG (H), and TC (I) in the CD-fed and EtOH-fed WT mice. (J) Hepatic mRNA levels of Fabp4 in the CD-fed and EtOH-fed WT mice. (K) Hepatic protein levels of FABP4 in the CD-fed and EtOH-fed WT mice. Results are presented as the mean ± SD. *P < 0.05, **P < 0.01, and ***P < 0.001.
Fig. 4
Fig. 4
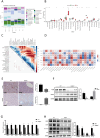
Biochemical, histopathologic, and immunohistochemical analyses of the EtOH-fed WT and Fabp4−/− mouse models. (A) Serum levels of FABP4 in the EtOH-fed WT and Fabp4−/− mice. (B) Hepatic mRNA levels of Fabp4 in the EtOH-fed WT and Fabp4−/− mice. (C) Hepatic protein levels of FABP4 in the EtOH-fed WT and Fabp4−/− mice. (D) H&E and oil red O staining of the liver tissue sections of the EtOH-fed WT and Fabp4−/− mice (scale bar, 100 μm). (E,F) Serum levels of ALT (E) and AST (F) in the EtOH-fed WT and Fabp4−/− mice. (GJ) Hepatic levels of TG (G), TC (H), TNF-α (I), and IL-6 (J) in the EtOH-fed WT and Fabp4−/− mice. Results are presented as the mean ± SD (n = 6/group). *P < 0.05, **P < 0.01, and ***P < 0.001.
Fig. 5
Fig. 5
Transcriptional profiling and bioinformatics analysis of the liver tissues of the EtOH-fed WT and Fabp4−/− mice. (A) Volcano plots of the DEGs in the liver tissues of the EtOH-fed WT and Fabp4−/− mice. (B) Number of DEGs in the liver tissues of the EtOH-fed WT and Fabp4−/− mice. (C) Heatmaps of the top 50 DEGs in the liver tissues of the EtOH-fed WT and Fabp4−/− mice. (D) GSEA profiles depicting the 14 significant GSEA sets in the EtOH-fed WT and Fabp4−/− mice. (EG) Bubble charts showing the GO-enriched MF (E), BP (F), and CC (G) terms of the DEGs in the EtOH-fed WT and Fabp4−/− mice. (H,I) Chord plots showing the GO-enriched items of the downregulated (H) and upregulated (I) DEGs in the EtOH-fed WT and Fabp4−/− mice. (J) Circle plot showing the KEGG-enriched terms of the DEGs in the EtOH-fed WT and Fabp4−/− mice.
Fig. 6
Fig. 6
Expression analysis of the p53 pathway, insulin/PI3K/AKT pathway, and SIRT1 pathway-related molecules in the EtOH-fed WT and Fabp4−/− mice. (A) Protein levels of p53, CASP3, BAX, and BCL-2 in the EtOH-fed WT and Fabp4−/− mice. (B) mRNA levels of Irs-1, Pi3k, and Akt in the EtOH-fed WT and Fabp4−/− mice. (C) Protein levels of P-IRS-1 (636), P-IRS-1 (307), P-PI3K, and P-AKT in the EtOH-fed WT and Fabp4−/− mice. (D) Hepatic mRNA levels of Sirt1 in the EtOH-fed WT and Fabp4−/− mice. (E) Hepatic protein levels of SIRT1 in the EtOH-fed WT and Fabp4−/− mice. (F) mRNA levels of Cpt-1, Ampk, and Pparα in the EtOH-fed WT and Fabp4−/− mice. (G) Protein levels of CPT-1, P-AMPK, and PPARα in the EtOH-fed WT and Fabp4−/− mice. (H) mRNA levels of Acc, Fasn, Srebf1, and Scd-1 in the EtOH-fed WT and Fabp4−/− mice. (I) Protein levels of P-ACC, FASN, SREBP1, and SCD-1 in the EtOH-fed WT and Fabp4−/− mice. (J) mRNA levels of Ikk and Nf-κb in the EtOH-fed WT and Fabp4−/− mice. (K) Protein levels of P-IKK and P-NF-κB in the EtOH-fed WT and Fabp4−/− mice. Results are presented as the mean ± SD. *P < 0.05, **P < 0.01, and ***P < 0.001.
Fig. 7
Fig. 7
Correlation analysis between FABP4 expression and macrophage levels in the EtOH-fed WT and Fabp4−/− mice. (A) Stacked bar chart showing the immune cells in the EtOH-fed WT and Fabp4−/− mice. (B) Box-plot of the proportion of 23 types of immune cells in the EtOH-fed WT and Fabp4−/− mice. (C) Heatmap of the correlation between the 23 immune cell types in the EtOH-fed WT and Fabp4−/− mice. (D) Heatmap of the correlation between infiltrating immune cells and p53, Sirt1, Nlrp3, Il1b, Fabp4, Cxcl1, and Bcl-2 in the EtOH-fed WT and Fabp4−/− mice. (E) Immunohistochemistry staining of F4/80 and CD206 proteins in the EtOH-fed WT and Fabp4−/− mice. (F) Hepatic protein levels of F4/80 and CD206 in the EtOH-fed WT and Fabp4−/− mice. (G) Hepatic mRNA levels of Tnf-α, Il-6, Il-1β, Il-8, Trailr1, Iy6g, Mcp-1, and Cxcl-1 in the EtOH-fed WT and Fabp4−/− mice. (H) Protein levels of NLRP3, CASP1, pro-IL-1β, and IL-1β in the EtOH-fed WT and Fabp4−/− mice. Results are presented as the mean ± SD. *P < 0.05, **P < 0.01, and ***P < 0.001.

Similar articles

References

    1. Asrani, S. et al. Reducing the global burden of alcohol-associated liver disease: A blueprint for action. Hepatology73(5), 2039–2050. 10.1002/hep.31583 (2021). 10.1002/hep.31583 - DOI - PMC - PubMed
    1. Seitz, H. et al. Alcoholic liver disease. Nat. Rev. Dis. Primers4(1), 16. 10.1038/s41572-018-0014-7 (2018). 10.1038/s41572-018-0014-7 - DOI - PubMed
    1. Lackner, C. & Tiniakos, D. Fibrosis and alcohol-related liver disease. J. Hepatol.70(2), 294–304. 10.1016/j.jhep.2018.12.003 (2019). 10.1016/j.jhep.2018.12.003 - DOI - PubMed
    1. Hydes, T. et al. Treating alcohol-related liver disease from a public health perspective. J. Hepatol.70(2), 223–236. 10.1016/j.jhep.2018.10.036 (2019). 10.1016/j.jhep.2018.10.036 - DOI - PubMed
    1. Li, B. et al. SnapShot: FABP functions. Cell182(4), 1066-1066.e1061. 10.1016/j.cell.2020.07.027 (2020). 10.1016/j.cell.2020.07.027 - DOI - PMC - PubMed

MeSH terms