. 2024 Aug 14:7:100137.
doi: 10.1016/j.crneur.2024.100137. eCollection 2024.

Membrane properties and coupling of macroglia in the optic nerve

Affiliations

Membrane properties and coupling of macroglia in the optic nerve

Nine Kompier et al. Curr Res Neurobiol. .

Abstract

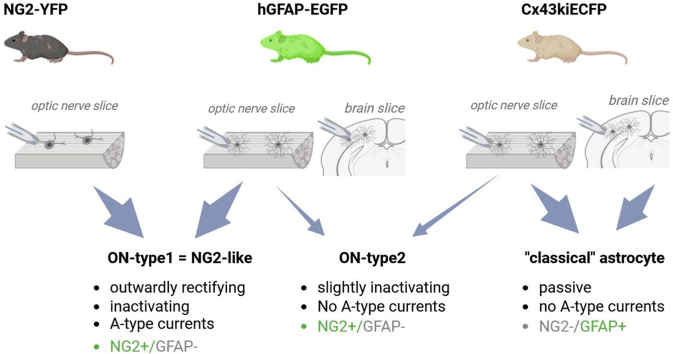
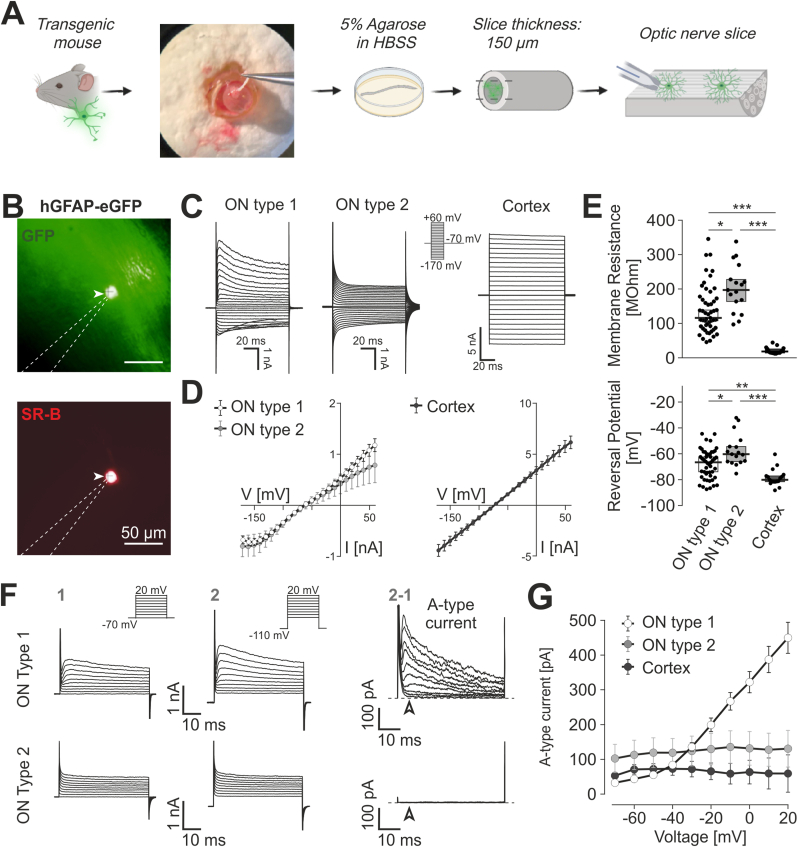
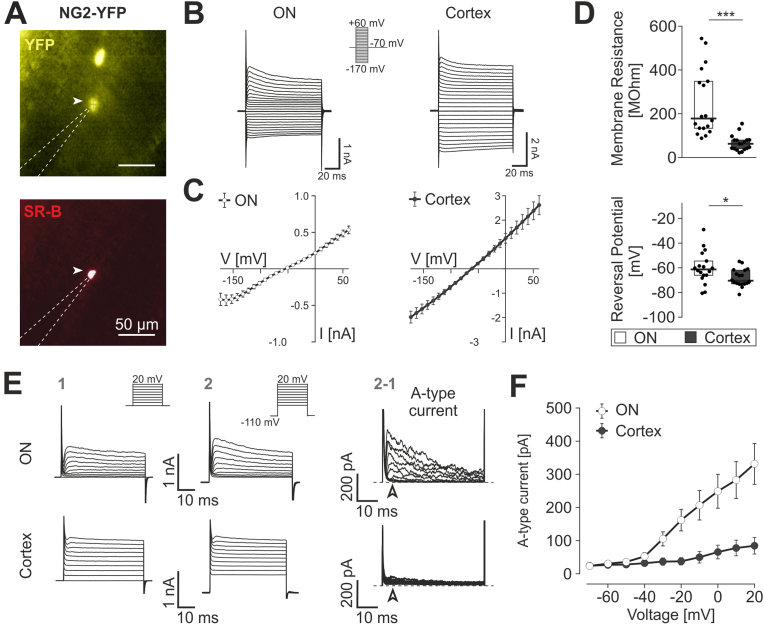
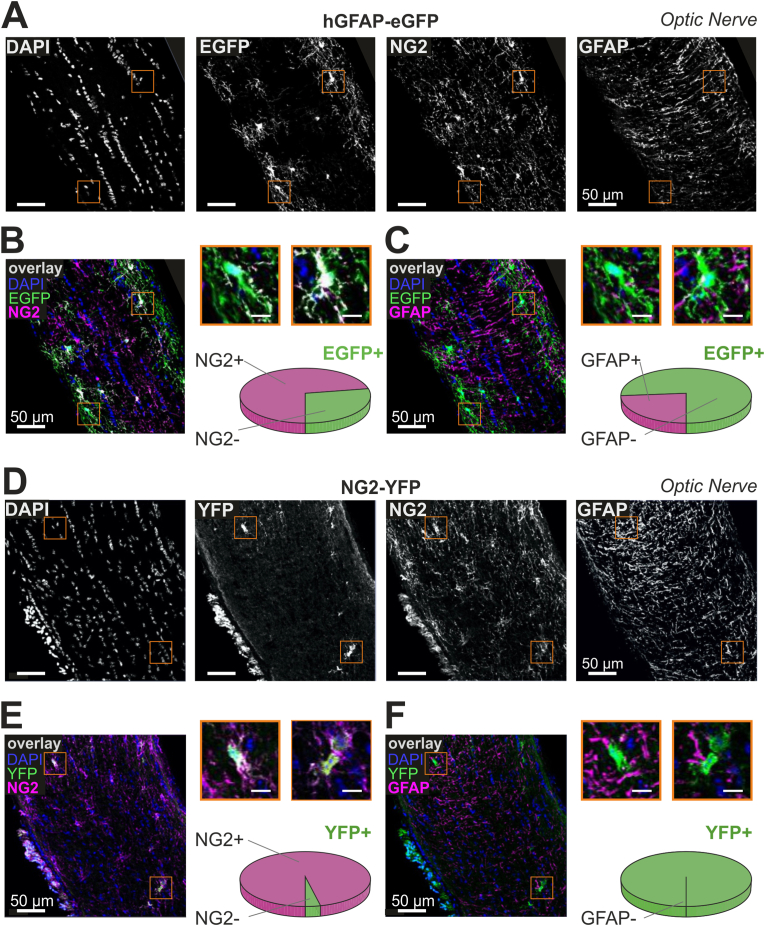
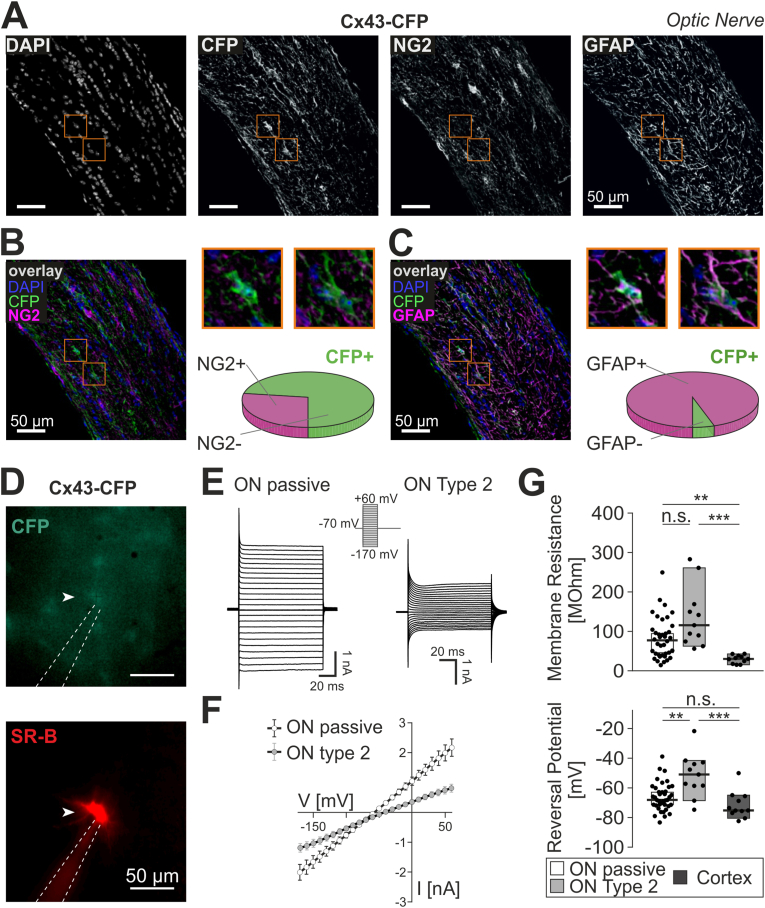
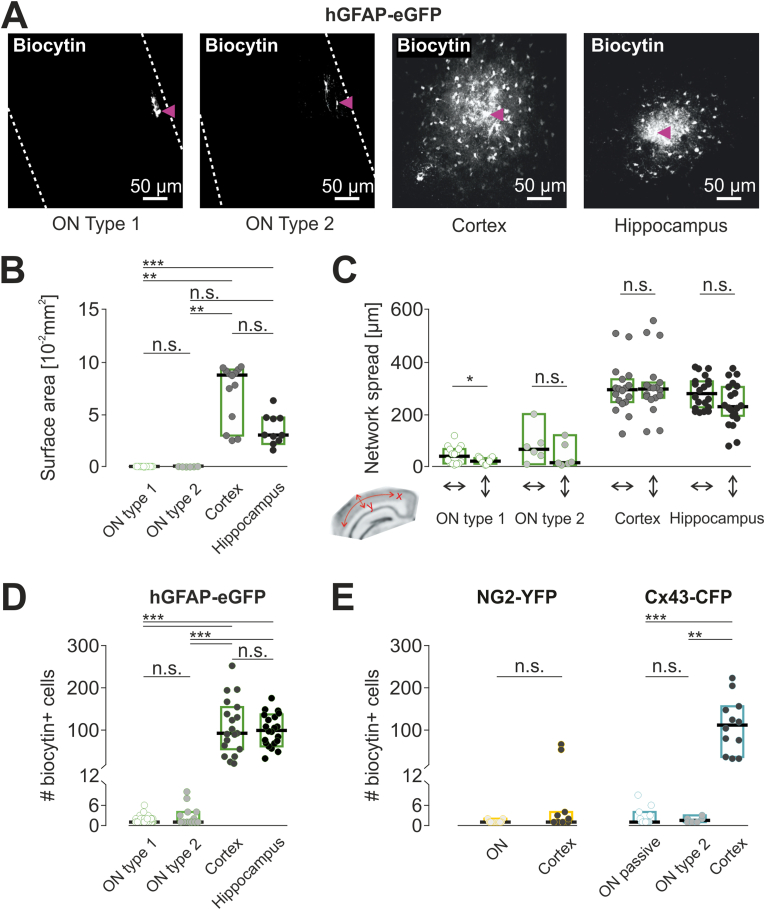
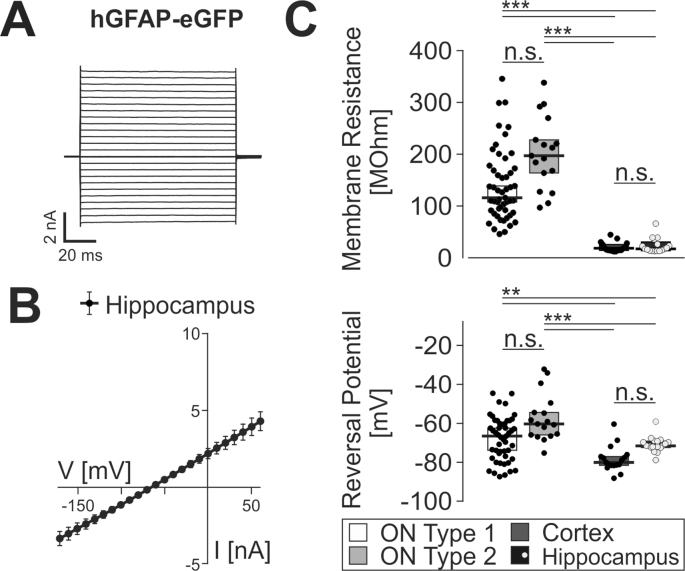
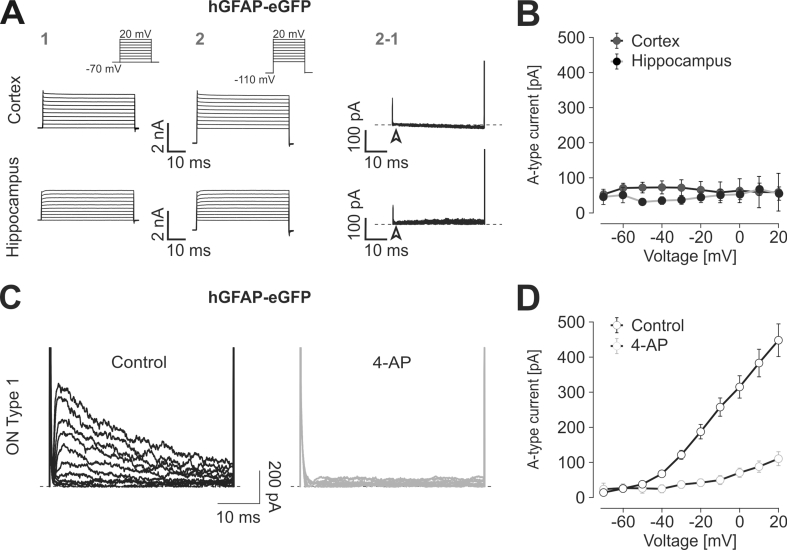
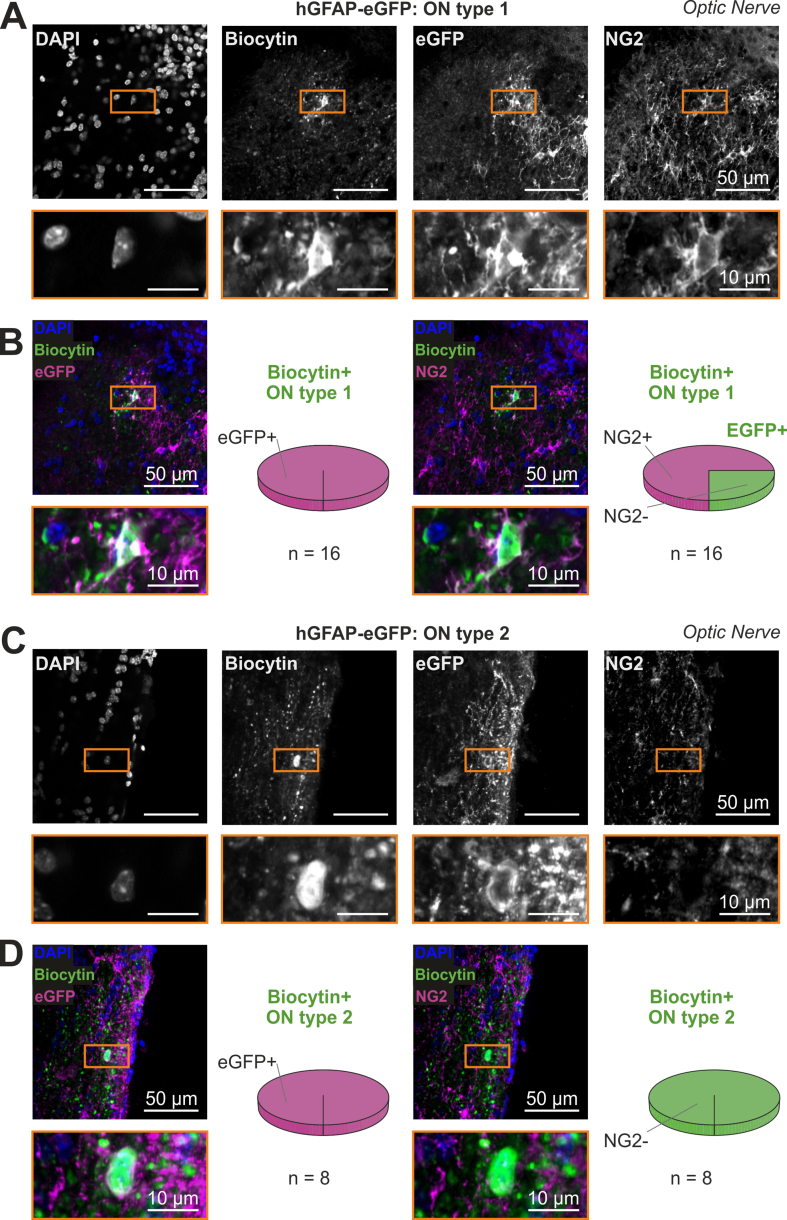
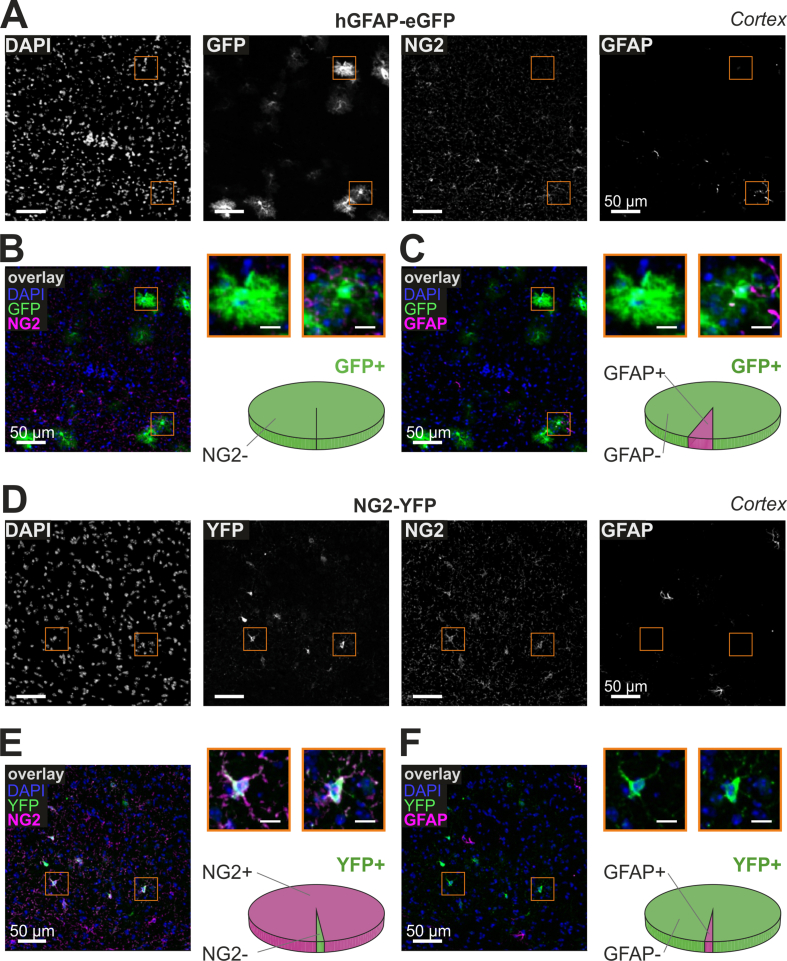
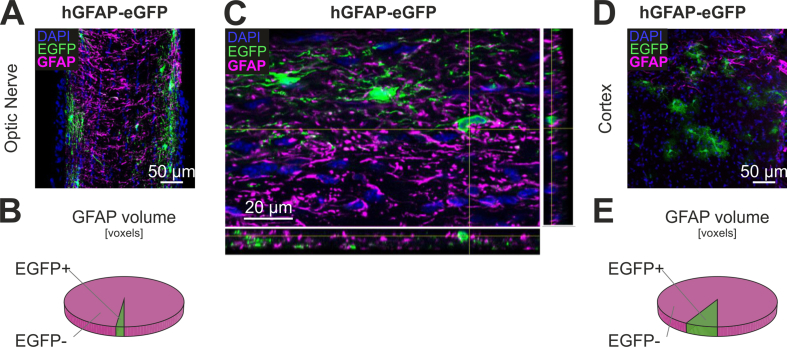
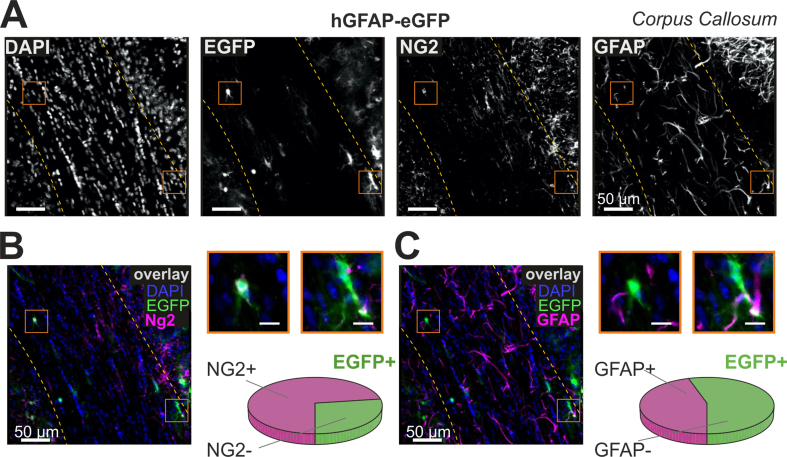
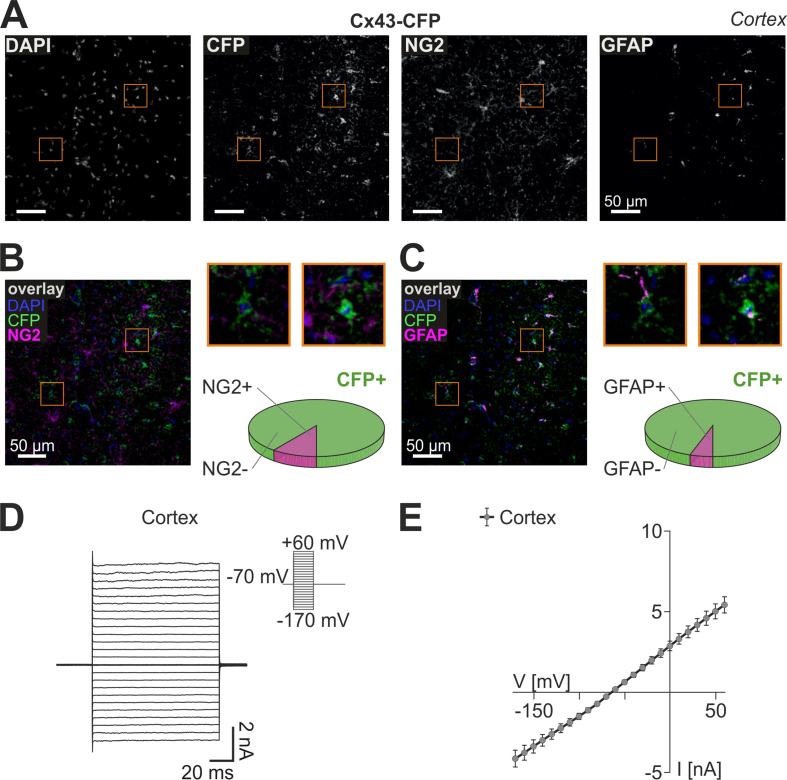
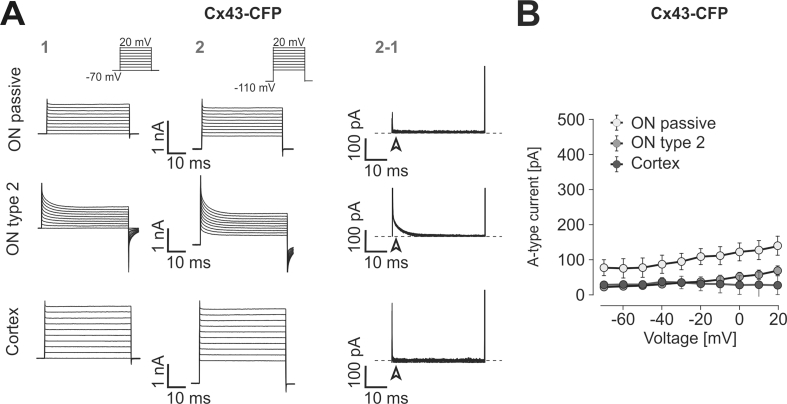
We established a longitudinal acute slice preparation of transgenic mouse optic nerve to characterize membrane properties and coupling of glial cells by patch-clamp and dye-filling, complemented by immunohistochemistry. Unlike in cortex or hippocampus, the majority of EGFP + cells in optic nerve of the hGFAP-EGFP transgenic mouse, a tool to identify astrocytes, were characterized by time and voltage dependent K+-currents including A-type K+-currents, properties previously described for NG2 glia. Indeed, the majority of transgene expressing cells in optic nerve were immunopositive for NG2 proteoglycan, whereas only a minority show GFAP immunoreactivity. Similar physiological properties were seen in YFP + cells from NG2-YFP transgenic mice, indicating that in optic nerve the transgene of hGFAP-EGFP animals is expressed by NG2 glia instead of astrocytes. Using Cx43kiECFP transgenic mice as another astrocyte-indicator revealed that astrocytes had passive membrane currents. Dye-filling showed that hGFAP-EGFP+ cells in optic nerve were coupled to none or few neighboring cells while hGFAP-EGFP+ cells in the cortex form large networks. Similarly, dye-filling of NG2-YFP+ and Cx43-CFP+ cells in optic nerve revealed small networks. Our work shows that identification of astrocytes in optic nerve requires distinct approaches, that the cells express membrane current patterns distinct from cortex and that they form small networks.

Keywords: Astrocyte; Cell coupling; In-situ patch clamp; Mouse optic nerve; NG2 glia; Transgenic reporter mouse.


Conflict of interest statement

The authors declare that they have no known competing financial interests or personal relationships that could have appeared to influence the work reported in this paper.

Figures

Image 1
Graphical abstract
Fig. 1
Fig. 1
GFAP-EGFP + cells in the optic nerve comprise two populations electrophysiologically distinct from typical astrocytes in forebrain (A) Schematic representation of optic nerve slicing procedure. The eye is removed from the transgenic mouse. The second image shows an eye with the optic nerve still attached (held by the forceps). Slicing procedure is detailed in methods. (B) Fluorescent images of a patched-clamped cell (arrowhead) in an optic nerve longitudinal slice of a hGFAP-EGFP mouse. Top: EGFP fluorescence image. Bottom: same cell labelled with sulforhodamine B after 20 min dialysis via the patch-pipette. Scale Bar: 50 μm. Dotted line: patch pipette. (C) Representative membrane currents of GFAP-EGFP+ cells in response to voltage pulses (inset) ranging from −160 mV to +60 mV in optic nerve (ON type 1 and type 2 cells) and cortex. (D) Average current-voltage relationships of optic nerve type 1 (n = 51, left), type 2 cells (n = 17, left) and cortical astrocytes (n = 17; right) (See also Figure S1). (E) Box plots (median with 25/75% CI) of membrane resistances (upper panel) and reversal potentials (lower panel) for GFAP-EGFP+ cells in optic nerve (ON type 1, ON type 2) and cortex (See also Figure S1). (F) Detection of A-type currents. Currents resulting from a voltage protocol as indicated by insets were recorded from optic nerve GFAP-EGFP+ cells (ON type 1 and ON type 2) from a holding potential of −70 mV (1) and a holding potential of −110 mV (2). The fast-decaying A-type currents resulting from subtraction (2–1) of the currents collected from −70 mV from those collected from −110 mV can be detected in ON type 1 cells (upper row) but not in ON type 2 cells (lower row) (See also Figure S2). (G) Average current density of A-type currents in ON type 1 (white, n = 35), ON type 2 (light grey, n = 13) and cortex (black, n = 15) plotted as a function of voltage.
Fig. 2
Fig. 2
NG2+ cells in optic nerve resemble electrophysiological properties of hGFAP-EGFP+ type 1 cells (A) Fluorescent images of a patch-clamped cell (arrowhead) in an optic nerve longitudinal slice of a NG2-YFP mouse. Top: The transgenic YFP signal visible under fluorescent light. Bottom: same cell labelled with sulforhodamine B after 20 min of dialysis. Scale Bar: 50 μm. Dotted line: patch pipette. (B) Representative membrane currents of NG2-YFP+ cells during voltage pulses (inset) ranging from −160 mV to +60 mV in optic nerve and cortex. (C) Average current-voltage relationships of optic nerve (n = 18, left) and cortical NG2 glia (n = 18; right). (D) Box plots (median with 25/75% CI) of membrane resistances (upper panel) and reversal potentials (lower panel) for NG2-YFP+ cells in optic nerve (ON) and cortex. (E) Detection of A-type currents. Currents resulting from a voltage protocol as indicated by insets were recorded from optic nerve and cortical NG2-YFP+ cells (ON) from a holding potential of −70 mV (1) and a holding potential of −110 mV (2). The rapidly decaying A-type currents resulting from subtraction (2–1) of the currents collected from −70 mV from those collected from −110 mV was evident in ON but these currents were small in cortical NG2 glia. (F) Average current density of A-type currents in optic nerve (ON) (white, n = 13) and cortex (black, n = 15) plotted as a function of voltage.
Fig. 3
Fig. 3
The hGFAP-EGFP transgene is targeted to NG2-like cells in optic nerve (A) Confocal images of a longitudinal optic nerve cryosection from a hGFAP-EGFP transgenic mouse. DAPI staining (left) shows typical “pearl cord” arrangement of glial cell nuclei. EGFP-positive cells (middle left) are often found close to the pia limitans. Processes extend preferentially in parallel to the axons. NG2 antibody (middle right) labels cell bodies and processes throughout the nerve. GFAP-labelled processes (right) typically stretched perpendicular to the longitudinal ON axis. Orange boxes refer to the magnified cells shown in panel B and C. Scale bars: 50 μm. (B) Overlay image of EGFP signal (green), NG2 (magenta) and DAPI (blue); same view field as in panel A. Overlapping signals appear in white. Smaller inset images (right top) are magnified views of two different EGFP + cells. Right bottom: The pie chart shows the percentage of EGFP+ cells that were positive (74%; magenta) and negative (26%; green) for NG2. Scale bars: 50 μm (large image), 10 μm (small images). (C) Same image as in (B) but overlaying EGFP (green), GFAP (magenta) and DAPI (blue). Note the sparse co-labelling of hGFAP-EGFP signals with endogenous GFAP. (DF) Same representation as (in A-C) of the ON of a NG2-YFP transgenic mouse. Note that transgenic YFP signals strongly coincide with NG2 staining (E) but not with GFAP (F) (See also Figure S3, S4, S5). (For interpretation of the references to colour in this figure legend, the reader is referred to the Web version of this article.)
Fig. 4
Fig. 4
Cx43-CFP+ cells in ON share passive membrane properties with cortical astrocytes and express GFAP (A) Confocal images of a longitudinal optic nerve cryosection from a Cx43kiECFP transgenic mouse. DAPI staining (left) shows typical “pearl cord” arrangement of glial cell nuclei. CFP-positive cells (middle left) are found throughout the optic nerve, NG2 antibody (middle right) labels cell bodies and processes throughout the nerve. GFAP-labelled processes (right) typically stretch perpendicular to the longitudinal ON axis. Orange boxes refer to the magnified cells shown in panel B and C. Scale bars: 50 μm. (B) Overlay image of CFP signal (green), NG2 (magenta) and DAPI (blue), same view field as in panel A. Overlapping signals appear in white. Smaller inset images (right top) are magnified views of two different CFP + cells. The pie chart shows percentage of CFP+ cells that were positive (27.3 %; magenta) and negative (72.7% green) for NG2. Scale bars: 50 μm (large image), 10 μm (small images). (C) Same depiction as in (B) but overlaying CFP (green), GFAP (magenta) and DAPI (blue). Note the robust co-labelling of Cx43-CFP signals with endogenous GFAP (See also Figure S6). (D) Fluorescent images of a patched cell in the optic nerve of a Cx43kiECFP mouse. Top: The intrinsic Cx43-CFP signal visible under fluorescent light. Bottom: same cell labelled with sulforhodamine B after 20 min of dialysis. Arrows mark the cell; dotted line outlines the patch pipette. Scale bars: 50 μm. (E) Representative membrane currents of Cx43-CFP + cells during voltage pulses (inset) ranging from −160 mV to +60 mV in optic nerve (passive and type 2) (See also Figure S6). (F) Average current-voltage relationships of passive (n = 38, white) and type 2-like (n = 11; black) CFP+ cells. (G) Box plots (median with 25/75% CI) of membrane resistances (upper panel) and reversal potentials (lower panel) for Cx43-CFP+ cells in optic nerve (ON) and cortex. (For interpretation of the references to colour in this figure legend, the reader is referred to the Web version of this article.)
Fig. 5
Fig. 5
Glial cells in ON are weakly coupled (A) Examples of biocytin-filled networks after patch-clamp/dye-filling of hGFAP-EGFP expressing cells in ON (type 1 and type 2 cell), cortex and hippocampus. Dashed lines illustrate edge of the nerve. Scale bars 50 μm. (BD) Analysis of coupled networks in ON (type 1: n = 37, type 2: n = 15), cortex (n = 19) and hippocampus (n = 21) of hGFAP-EGFP mice. Scatter plots depict median values of number of biocytin+ cells (B) surface area of biocytin+ cells (C) dye-spread in horizontal and vertical directions (D) median values of number of biocytin+ cells in hGFAP-EGFP mice (E) median values of number of biocytin+ cells in NG2-YFP mice (ON: n = 11, cortex: n = 12) and biocytin+ cells in Cx43-CFP mice (passive: n = 16, type 2: n = 6, cortex: n = 12) in optic nerve and cortical slices.
figs1
figs1
figs2
figs2
figs3
figs3
figs4
figs4
figs5
figs5
figs6
figs6
figs7
figs7
figs8
figs8

Similar articles

References

    1. Alghamdi B., Fern R. Phenotype overlap in glial cell populations: astroglia, oligodendroglia and NG-2(+) cells. Front. Neuroanat. 2015;9:49. - PMC - PubMed
    1. Allen N.J., Lyons D.A. Glia as architects of central nervous system formation and function. Science. 2018;362(6411):181–185. - PMC - PubMed
    1. Barres B.A., et al. Ion channel expression by white matter glia: the O-2A glial progenitor cell. Neuron. 1990;4(4):507–524. - PubMed
    1. Bedner P., Jabs R., Steinhäuser C. Properties of human astrocytes and NG2 glia. Glia. 2020;68(4):756–767. - PubMed
    1. Berger T., Schnitzer J., Kettenmann H. Developmental changes in the membrane current patter, K+ buffer capacity, and morphology of glial cells in the corpus callosum slice. J. Neurosci. 1991;11(10):3008–3024. - PMC - PubMed

LinkOut - more resources