. 2024 Sep 9:13:RP94899.
doi: 10.7554/eLife.94899.

Machine learning approaches identify immunologic signatures of total and intact HIV DNA during long-term antiretroviral therapy

Affiliations

Machine learning approaches identify immunologic signatures of total and intact HIV DNA during long-term antiretroviral therapy

Lesia Semenova et al. Elife. .

Abstract

Understanding the interplay between the HIV reservoir and the host immune system may yield insights into HIV persistence during antiretroviral therapy (ART) and inform strategies for a cure. Here, we applied machine learning (ML) approaches to cross-sectional high-parameter HIV reservoir and immunology data in order to characterize host-reservoir associations and generate new hypotheses about HIV reservoir biology. High-dimensional immunophenotyping, quantification of HIV-specific T cell responses, and measurement of genetically intact and total HIV proviral DNA frequencies were performed on peripheral blood samples from 115 people with HIV (PWH) on long-term ART. Analysis demonstrated that both intact and total proviral DNA frequencies were positively correlated with T cell activation and exhaustion. Years of ART and select bifunctional HIV-specific CD4 T cell responses were negatively correlated with the percentage of intact proviruses. A leave-one-covariate-out inference approach identified specific HIV reservoir and clinical-demographic parameters, such as age and biological sex, that were particularly important in predicting immunophenotypes. Overall, immune parameters were more strongly associated with total HIV proviral frequencies than intact proviral frequencies. Uniquely, however, expression of the IL-7 receptor alpha chain (CD127) on CD4 T cells was more strongly correlated with the intact reservoir. Unsupervised dimension reduction analysis identified two main clusters of PWH with distinct immune and reservoir characteristics. Using reservoir correlates identified in these initial analyses, decision tree methods were employed to visualize relationships among multiple immune and clinical-demographic parameters and the HIV reservoir. Finally, using random splits of our data as training-test sets, ML algorithms predicted with approximately 70% accuracy whether a given participant had qualitatively high or low levels of total or intact HIV DNA . The techniques described here may be useful for assessing global patterns within the increasingly high-dimensional data used in HIV reservoir and other studies of complex biology.

Keywords: HIV; human; immune cells; infectious disease; machine learning; microbiology.


Conflict of interest statement

LS, YW, SF, NA, AC, DM, NG, DM, CR, EB No competing interests declared

Figures

Figure 1.
Figure 1.. Duration of treatment and the HIV reservoir.
Scatterplots for years of antiretroviral therapy (ART) versus total HIV reservoir frequency (A), intact reservoir frequency (B), and percent intact (C) are shown. Each dot represents an individual study participant. Correlation coefficients and corresponding p-values are shown for each plot. Participants that have missing values of years of ART were not included in the plot. For percent intact, piece-wise linear function with two breaks is fitted. For total HIV reservoir frequency a linear function is fitted.
Figure 1—figure supplement 1.
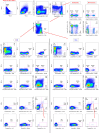
Figure 1—figure supplement 1.. Representative flow cytometry gating is shown for one sample from the 115-person cohort.
Figure 1—figure supplement 2.
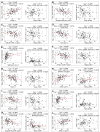
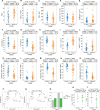
Figure 1—figure supplement 2.. Abundance of immune cell subsets correlates with HIV reservoir (part I).
Abundance of immune cell subsets correlates with HIV reservoir. Continuation in Figure 1—figure supplement 3, Figure 1—figure supplement 4. Scatterplots for selected examples of immune cell subsets: (A) %CD8 T, (B) %CD38+/HLADR- CD4 T, (C) KLRG1-/PD-1- CD4 T, (D) %Tn CD4 T, (E) %NKG2A+ CD4 T, (F) %PD-1-/CCR7+ CD4 T, (G) %CD4T, (H) %Tcm CD8 T, (I) %CD38+ CD4 T, (J) %PD-1-/CCR7- CD4 T, (K) %CD38+/HLA-DR- CD8 T, (L) %PD-1+ CD4 T, versus HIV reservoir frequency or percent intact are shown. Additionally, scatterplots of immune cell subsets versus time on therapy are displayed. Each dot represents an individual study participant. Correlation coefficients and corresponding p-values are shown for each plot. For time plots, participants that have missing values of years of antiretroviral therapy (ART) were not included in the plot. The piece-wise linear function with one break is fitted if a break is between 1 and 20 years, otherwise, a linear function is fitted. Red trendline is shown for significant correlations.
Figure 1—figure supplement 3.
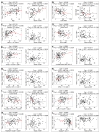
Figure 1—figure supplement 3.. Abundance of immune cell subsets correlates with HIV reservoir (part II).
Abundance of immune cell subsets correlates with HIV reservoir. Continuation in Figure 1—figure supplement 2, Figure 1—figure supplement 4. Scatterplots for selected examples of immune cell subsets or participant characteristics (A) Age, (B) CD4 nadir, (C) %PD-1+ Tn CD4 T, (D) %Tn CD8 T, (E) %PD-1+/CCR7+ CD8 T, (F) %CD38-/HLA-DR+ CD4 T, (G) %KLRG1-/PD-1- CD8 T, (H) %PD-1+ Tn CD8 T, (I) %CD38+/HLA-DR- Tn CD8 T, (J) %PD-1+/CCR7+ CD4 T, (K) %KLRG1+/CD27+ CD8 T, (L) %CD27+ CD4 T, versus HIV reservoir frequency or percent intact are shown. Additionally, scatterplots of immune cell subsets versus time on therapy are displayed. Each dot represents an individual study participant. Correlation coefficients and corresponding p-values are shown for each plot. For time plots, participants that have missing values of years of antiretroviral therapy (ART) were not included in the plot. The piece-wise linear function with one break is fitted if a break is between 1 and 20 years, otherwise, a linear function is fitted. Red trendline is shown for significant correlations.
Figure 1—figure supplement 4.
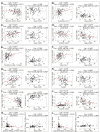
Figure 1—figure supplement 4.. Abundance of immune cell subsets correlates with HIV reservoir (part III).
Abundance of immune cell subsets correlates with HIV reservoir. Continuation in Figure 1—figure supplement 2, Figure 1—figure supplement 3. Scatterplots for selected examples of immune cell subsets, (A) %KLRG1-/CD27+ CD4 T, (B) HLA-DR+ CD4 T, (C) % PD-1+ CD8 T, (D) %CD38+ CD8 T, (E) %CD38-/HLA-DR+ Tn CD8 T, (F) %Tem CD4 T, (G) %CD8 T, (H) %CD4 T, (I) %CD127+ CD4 T, (J) %CD38+ CD8 T, (K) %CD107-/IFNγ-/IL-2+/TNFα+ CD4 T, (L) %CD107-/IFNγ+/IL-2+/TNFα- CD4 T, versus HIV reservoir frequency or percent intact are shown. Additionally, scatterplots of immune cell subsets versus time on therapy are displayed. Each dot represents an individual study participant. Correlation coefficients and corresponding p-values are shown for each plot. For time plots, participants that have missing values of years of antiretroviral therapy (ART) were not included in the plot. The piece-wise linear function with one break is fitted if a break is between 1 and 20 years, otherwise, a linear function is fitted. Red trendline is shown for significant correlations.
Figure 1—figure supplement 5.
Figure 1—figure supplement 5.. CD4/CD8 and (%CD127+ CD4T)/CD8 ratios correlate with total and intact reservoir frequency.
CD4/CD8 and (%CD127+ CD4T)/CD8 ratios correlate with total and intact reservoir frequency. Normalized (values transformed to be between 0 and 1) CD4/CD8 (A) and (%CD127+ CD4T)/CD8 (B) ratios are shown on the x-axis and the normalized natural logarithm (loge) of the total reservoir, intact reservoir and percent intact on the y-axis. Spearman correlation was computed between ratios and HIV reservoir characteristics. Outliers (red data points) were removed with the DBSCAN clustering algorithm and a linear regression model was fitted (black line) to the remaining data points. Spearman correlations, R2 scores, and mean squared error after outlier removal are displayed.
Figure 2.
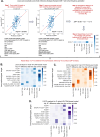
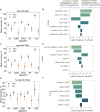
Figure 2.. Leave-one-covariate-out (LOCO) analysis for clinical–demographic features and reservoir characteristics while predicting immunophenotypes.
(A) Explanation of LOCO analysis based on example of %CD4 T for clinical–demographic features and reservoir characteristics while predicting immunophenotypes. Analysis was performed for all 133 immunophenotypes considered in the study. The top 10 biggest drops in adjusted R2 scores are reported for models that use total reservoir frequency (B), intact reservoir frequency (C), or percent intact (D) as features in addition to clinical and demographic information. Participants with missing years of antiretroviral therapy (ART) values are excluded from this analysis. The missing value of the CD4 nadir for one participant is imputed.
Figure 2—figure supplement 1.
Figure 2—figure supplement 1.. Leave-one-covariate-out (LOCO) analysis visualization for all 133 immunophenotypes.
LOCO analysis for clinical–demographic features and reservoir characteristics while predicting immunophenotypes. Analysis that is described in Figure 2 was performed for all 133 immunophenotypes considered in the study. Drops in adjusted R2 scores are reported for models that use total reservoir frequency (A), intact reservoir frequency (B), or percent intact (C) as features in addition to clinical and demographic information such as age, biological sex, race, years of treatment, CD4 nadir, recent CD4 count, and years of HIV before treatment (=NA, <1 1). On the x-axis, we show features that were dropped from the model. On the y-axis, we display immunophenotypes, which are targets (outcomes) for the linear regression models. In Supplementary file 1f–h, we show the actual values of drops in adjusted R2 score.
Figure 2—figure supplement 2.
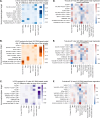
Figure 2—figure supplement 2.. Coefficient visualization for linear regression models that predict immunophenotypes in Figure 2B–D.
Coefficient visualization for linear regression models that predict immunophenotypes based on clinical, demographic information, and HIV characteristics. Leave-one-covariate-out (LOCO) analysis from Figure 3 for total reservoir-based (A), intact reservoir-based (B), and percent intact-based (C) models. The drops in adjusted R2 scores are shown after removing a feature and training a new model without it. Coefficient visualization for models that include clinical and demographic information such as age, biological sex, years of treatment, CD4 nadir, recent CD4 count, and years of HIV before treatment = NA, years of HIV before treatment <1, years of HIV before treatment ≥ 1 and total reservoirs frequency (D) or intact reservoir frequency (E), or percent intact (F). No features are dropped from these models, they are ‘Include all’ models from Supplementary file 1f–h. On the x-axis, the feature is shown, and on the y-axis the target (immunophenotypes from A–C). The heatmap displays the coefficient in front of that variable in the model (if the model is %CD4 T =β1Total+β2Age+β3Sex+..., then β1,β2,β3,... are visualized), where positive coefficients are shown in red and negative in blue.
Figure 3.
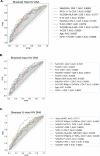
Figure 3.. Receiver operating characteristic (ROC) curves identify people with HIV (PWH) parameters that can classify reservoir characteristics.
For total reservoir frequency (A), intact reservoir frequency (B), and percent intact (C), ROC curves are plotted for all 144 immune markers, demographics, and clinical variables (shown in gray). Axes represent the true positive rate (TPR) and the false positive rate (FPR) for each variable for classifying study participants into low (below median) versus high (above median) reservoir frequency. ROC curves for 10 variables with the highest area under the curve (AUC) values are shown in color for each HIV reservoir characteristic. Striped black lines represent the ROC curves of a random model. For years of antiretroviral therapy (ART) ROC curves, we exclude participants with missing years of ART values.
Figure 4.
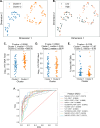
Figure 4.. Dimension reduction reveals two major clusters of people with HIV (PWH) with distinct immune systems and reservoirs.
(A) PaCMAP was applied to the data using the ten immune cell features with the highest area under the curve (AUC) values for classifying participants based on total reservoir frequency, and two clusters (clusters 1 and 2) are identified. (B) Same as A but data points are color-coded by total reservoir frequency (high = pink, low = gray). Total reservoir frequency (C), intact reservoir frequency (D), and percent intact (E) are shown for participants within each cluster. (F) Key immune cell features that distinguish cluster 1 from cluster 2 are identified by visualizing the features with the highest AUC values with respect to classifying cohort participants based on cluster membership. Axes represent the true positive rate (TPR) and the false positive rate (FPR) for each variable. Immune markers and clinical–demographic features are shown for each cluster in Figure 4—figure supplement 1.
Figure 4—figure supplement 1.
Figure 4—figure supplement 1.. Additional dimension reduction results.
Dimension reduction supplemental figures. (A) Participant age is shown within each cluster. (B) Participant years of antiretroviral therapy (ART) are shown within each cluster. (C) Participant CD4 nadir is shown within each cluster. (D) Participant CD4 count is shown within each cluster. (E–O) Participant immune features of interest are shown, where plots of immune features with similar names are placed nearby. (P) Clusters with data points color-coded by intact reservoir frequency (high = pink, low = gray). (Q) Clusters with data points color-coded by percent intact reservoir frequency (high = pink, low = gray). (R) Relative proportions of cannabis (CB) users and non-users (non-CB) are shown for each cluster. (S) Total reservoir frequencies (per million CD4 T cells) for non-users and CB users are shown. (T) The ages of study participants for non-users and CB users are shown.
Figure 4—figure supplement 2.
Figure 4—figure supplement 2.. Principal component analysis (PCA) visualization.
Left: PCA plot with data points color-coded by the membership of clusters identified in Figure 4. Right: PCA plot with data points color-coded by total reservoir frequency (high = pink, low = gray).
Figure 5.
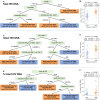
Figure 5.. Decision tree visualization of the association of immune cell subsets with reservoir characteristics.
(A, C, E) Host variables (immune cell frequencies, demographic, and clinical information) were used to visualize the people with HIV (PWH) dataset using the optimal sparse decision trees algorithm Generalized and Scalable Optimal Sparse Decision Trees (GOSDT). The overall set of PWH was classified as likely having high (above median, orange ‘leaves’) or low (below median, blue ‘leaves’) total reservoir frequency (A), intact reservoir frequency (C), and percent intact (E). In each leaf, ‘med’ denotes the median HIV characteristic of PWH, N is the number of PWH in the leaf, and MN is the number of mislabeled PWH. (B, D, F) PWH in model leaves associated with high (orange) or low (blue) reservoir frequency characteristics were aggregated and a Mann–Whitney U test was performed to determine statistical significance between the actual total reservoir frequency of the ‘high’ and ‘low’ groups for total reservoir frequency (B), intact reservoir frequency (D), and percent intact (F). For the percent intact tree we exclude participants with missing values of years of antiretroviral therapy (ART). For total and intact reservoir frequency, missing values of years of ART were imputed, however, since the trees do not use this variable, imputations do not influence results. Visualization trees are explained with sets of rules in figure supplements.
Figure 5—figure supplement 1.
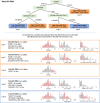
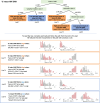
Figure 5—figure supplement 1.. The total reservoir frequency visualization tree is explained with a set of rules.
The total reservoir frequency visualization tree is explained with a set of rules. For every leaf, the path that leads to this leaf is described. The histogram of the variable and split value for every node used in the tree is shown.
Figure 5—figure supplement 2.
Figure 5—figure supplement 2.. The intact reservoir frequency visualization tree is explained with a set of rules.
The intact reservoir frequency visualization tree is explained with a set of rules. For every leaf, the path that leads to this leaf is described. The histogram of the variable and split value for every node used in the tree is shown.
Figure 5—figure supplement 3.
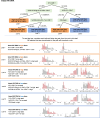
Figure 5—figure supplement 3.. The percent intact visualization tree is explained with a set of rules.
The percent intact visualization tree is explained with a set of rules. For every leaf, the path that leads to this leaf is described. The histogram of the variable and split value for every node used in the tree is shown.
Figure 6.
Figure 6.. Predicting HIV reservoir characteristics with machine learning.
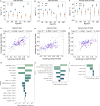
Average training and test accuracies over 10 training and test data splits for Random Forest (RF), Gradient Boosted Trees (GBT), Support Vector Machines with RBF kernel (SVM), Logistic Regression (LR), and CART models for total reservoir frequency (A), intact reservoir frequency (C), and percent intact (E) are shown. For one split of training and test sets, LR models are visualized for total reservoir (B), intact reservoir (D), and percent intact (F). On the y-axis, we show variables used by the model, while the x-axis displays coefficient values for individual variables used by models. For percent intact models, we exclude participants with missing values of years of antiretroviral therapy (ART). For total and intact reservoir frequency, missing values of years of ART were imputed. The missing value of the CD4 nadir for one participant was imputed using the Multivariate Imputation by Chained Equations (MICE) algorithm.
Figure 6—figure supplement 1.
Figure 6—figure supplement 1.. Using machine learning to predict reservoir frequency.
Using machine learning to predict reservoir frequency. Average training and test R2 scores over different training and test data splits for Linear Regression (LR), Ridge Regression (RR), Kernel Regression with RBF kernel (KR), Decision Tree Regressor (DT), Random Forest (RF), and Gradient Boosted Trees (GBT) models are shown for predicting total reservoir frequency (A), intact reservoir frequency (B), and percentage intact (C). For one split of training and test sets, ridge regression performance is shown for total reservoir frequency (D), intact reservoir frequency (E), and linear regression for percentage intact (F). On the x-axis, the actual values of HIV reservoir characteristics are shown, while on the y-axis the outputs of models are shown for training data (blue dots) and test data (red dots). For the same training and test split, ridge regression model feature coefficients are visualized for total reservoir (G), intact reservoir (H), and linear regression model feature coefficients are visualized for percent intact (I). On the y-axis, we show variables used by the model, while on the x-axis coefficient values for linear models based on these variables. For percent intact models, we exclude participants with missing values of years of antiretroviral therapy (ART). For total and intact reservoir frequency, missing values of years of ART were imputed. The missing value of the CD4 nadir for one participant was imputed as well using the MICE algorithm.

Update of

Similar articles

References

    1. Alter G, Suscovich TJ, Teigen N, Meier A, Streeck H, Brander C, Altfeld M. Single-stranded RNA derived from HIV-1 serves as a potent activator of NK cells. Journal of Immunology. 2007;178:7658–7666. doi: 10.4049/jimmunol.178.12.7658. - DOI - PubMed
    1. Astorga-Gamaza A, Perea D, Sanchez-Gaona N, Calvet-Mirabent M, Gallego-Cortés A, Grau-Expósito J, Sanchez-Cerrillo I, Rey J, Castellví J, Curran A, Burgos J, Navarro J, Suanzes P, Falcó V, Genescà M, Martín-Gayo E, Buzon MJ. KLRG1 expression on natural killer cells is associated with HIV persistence, and its targeting promotes the reduction of the viral reservoir. Cell Reports. Medicine. 2023;4:101202. doi: 10.1016/j.xcrm.2023.101202. - DOI - PMC - PubMed
    1. Banga R, Procopio FA, Noto A, Pollakis G, Cavassini M, Ohmiti K, Corpataux J-M, de Leval L, Pantaleo G, Perreau M. PD-1(+) and follicular helper T cells are responsible for persistent HIV-1 transcription in treated aviremic individuals. Nature Medicine. 2016;22:754–761. doi: 10.1038/nm.4113. - DOI - PubMed
    1. Bastard J-P, Soulié C, Fellahi S, Haïm-Boukobza S, Simon A, Katlama C, Calvez V, Marcelin A-G, Capeau J. Circulating interleukin-6 levels correlate with residual hiv viraemia and markers of immune dysfunction in treatment-controlled HIV-infected patients. Antiviral Therapy. 2012;17:915–919. doi: 10.3851/IMP2093. - DOI - PubMed
    1. Bernal S, Puertas MC, Morón-López S, Cranston RD, Urrea V, Dalmau J, Salgado M, Gálvez C, Erkizia I, McGowan I, Scherrer D, Revollo B, Sirera G, Santos JR, Clotet B, Paredes R, Martinez-Picado J. Impact of obefazimod on viral persistence, inflammation, and immune activation in people with human immunodeficiency virus on suppressive antiretroviral therapy. The Journal of Infectious Diseases. 2023;228:1280–1291. doi: 10.1093/infdis/jiad251. - DOI - PMC - PubMed