. 2024 Aug 23:15:1389387.
doi: 10.3389/fimmu.2024.1389387. eCollection 2024.

Zinc dampens antitumor immunity by promoting Foxp3+ regulatory T cells

Affiliations

Zinc dampens antitumor immunity by promoting Foxp3+ regulatory T cells

Sugandha Narayan et al. Front Immunol. .

Abstract

Introduction: The role of zinc (Zn) in tumor development and immune modulation has always been paradoxical. This study redefines our understanding of the impact of Zn on cancer progression and therapeutic strategies.

Methods: We investigated the effects of dietary Zn levels on tumor progression and immune responses. This included examining the impact of both high and deficient dietary Zn, as well as Zn chelation, on tumor growth and immune cell populations. Specifically, we analyzed the frequency of Foxp3+ regulatory T-cells (Tregs) and identified the role of FOXO1 in Zn-mediated effects on Tregs. Additionally, we explored the therapeutic potential of clioquinol (CQ) in enhancing α-PD-1 immunotherapy responses, particularly in melanoma.

Results: Our findings show that high dietary Zn promotes tumor progression by fostering a protumorigenic environment mediated by T cells. Increased Zn intake was found to facilitate tumor progression by increasing Foxp3+ Treg frequency. In contrast, deficiency in dietary Zn and chelation of tissue Zn emerged as potent drivers of antitumor immunity. We pinpointed FOXO1 as the master regulator governing the influence of Zn on Tregs.

Discussion: These results reveal a novel mechanistic insight into how Zn influences tumor progression and immune regulation. The identification of FOXO1 as a key regulator opens new avenues for understanding the role of Zn in cancer biology. Furthermore, we introduce a promising therapeutic approach by showing that administering clioquinol (CQ) significantly enhances α-PD-1 immunotherapy response, particularly in melanoma. These revelations transform our comprehension of the multifaceted role of Zn in tumorigenesis and immune regulation, highlighting innovative possibilities for cancer therapy.

Keywords: FOXO1; PD-1; antitumor immunity; cancer; checkpoint inhibition therapy; regulatory T cell; zinc.


Conflict of interest statement

The authors declare that the research was conducted in the absence of any commercial or financial relationships that could be construed as a potential conflict of interest.

Figures

Figure 1
Figure 1
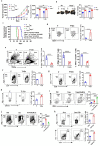
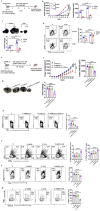
High zinc (Zn) intake increases tumor burden in syngeneic mouse tumor models. (A) Schematic representation of the experiment in which B16F10 melanoma was implanted in C57BL/6 mice. While one of the groups was given a Zn supplement of 80 mg/kg/day, the other was kept on a normal diet as the control. (B) The rate of growth of tumor volume. (C) The tumor mass in the groups of mice consuming a normal diet (T) and high Zn intake (T+Zn). (D) The percent survival of mice bearing B16F10 melanoma consuming a normal diet (T) vs. high Zn intake (T+Zn). (E–G) Histology of the tumor tissue samples: hematoxylin and eosin (H&E) stain (×10) to identify pus zones (E), immunohistochemistry (IHC) (×10) to identify Ki67 expression (F), and Masson’s Fontana stain (×20) to identify the level of melanin production (G). (H) Schematic representation of the metastasis model in which B16F10 cells were injected intravenously into the tail vein and given Zn supplement for one group of mice (T+Zn) while the other group was kept on a normal diet as the control (T). (I) The foci count on the lungs of T vs. T+Zn. (J) The percent survival of metastasis in group T vs. group T+Zn. (K) Schematic representation of the surgical model experiment in which tumor from mice was surgically removed at 1,000 mm3 and then the animals were put either on a normal diet (T) or a high Zn diet (T+Zn). (L) Rate of growth of tumor volume post-surgery. (M) Post-surgery tumor recurrence in group T vs. group T+Zn. (N) The post-surgery percent survival rate in the Zn-supplemented group compared with the control group consuming a normal diet. Data are representative of the mean ± SEM from three independent experiments. *P < 0.05, **P < 0.01, ***P < 0.001, and ****P < 0.0001 (Student’s t-test or one-way ANOVA); percent survival by the Mantel–Cox test; number of animals (n = 7) in all experiments.
Figure 2
Figure 2
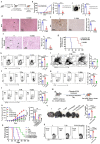
Zn mediates the protumor effect via T cells. (A) B16F10 melanoma was implanted in C57BL/6 mice (Wt) and RAG1−/− mice consuming a normal diet (T) and a high Zn diet (T+Zn). The rate of tumor progression is measured every alternative day until the volume reached 2,000 mm3. (B) The endpoint tumor mass. (C) Percent survival curve of B16F10 melanoma-bearing C57BL/6 mice (Wt) vs. RAG1−/− mice consuming a normal diet (T) and a high Zn diet (T+Zn). (D) Immunophenotyping of Foxp3+ Treg cells (regulatory T cells) from the tumor-infiltrated lymphocytes (TILs) of B16F10 melanoma-bearing C57BL/6 mice consuming a normal diet (T) and high Zn intake (T+Zn). (E) Immunophenotyping of IFN-γ+ TNF-α+ CD4+ T (Th1) cells from the TILs of T and T+Zn. (F–H) Immunophenotyping of PD-1+ CD4+ T cells, PD-1+ CD8+ T cells, and PD-1+ γδTCR+ T cells from the TILs of T and T+Zn. (I, J) Naive CD4+ T cells and CD8+ T cells are sorted from the spleen of healthy C57BL/6 mice and activated/differentiated in vitro in the presence or absence of Zn supplement (50 μM) into Treg cells and Th1 cells. (K) Naive CD4+ T cells and CD8+ T cells are sorted from the spleen of healthy C57BL/6 mice and activated in vitro with α-CD3 and α-CD28 antibodies for 48–72 h with or without Zn (50 μM) supplement and measured surface expression of PD-1. Data are representative of the mean ± SEM from three independent experiments. *P < 0.05, **P < 0.01, ***P < 0.001, and ****P < 0.0001 (Student’s t-test or one-way ANOVA); percent survival by the Mantel–Cox test; number of animals (n = 7) in all experiments.
Figure 3
Figure 3
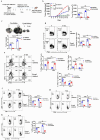
Dietary Zn deficiency and tissue Zn chelation promote antitumor immunity. (A) Schematic representation of the experiment in which C57BL/6 mice were fed with a Zn-deficient diet (0.85 ppm) for 15 days before B16F10 melanoma implantation and the diet was continued until the endpoint of the experiment. (B) Rate of growth of tumor volume in the groups of mice consuming a normal diet (T) and a Zn-deficient diet (T+ZDD). (C) The tumor mass in the groups of mice consuming a normal diet (T) and a Zn-deficient diet (T+ZDD). (D–F) Histology of the tumor tissue samples: hematoxylin and eosin (H&E) stain (×10) to identify pus zones (D), immunohistochemistry (IHC) (×40) to identify Ki67 expression (E), and Masson’s Fontana stain (×20) to identify the level of melanin production (F). (G) Percent survival curve of B16F10 melanoma-bearing mice consuming a laboratory diet vs. a Zn-deficient diet. (H) Immunophenotyping of Foxp3+ Treg cells (regulatory T cells) from the tumor-infiltrated lymphocytes (TILs) of B16F10 melanoma-bearing C57BL/6 mice consuming a normal diet (T), high Zn intake (T+Zn), and a Zn-deficient diet (T+ZDD). (I) Immunophenotyping of IFN-γ+ TNF-α+ CD4+ T (Th1) cells from the TILs of T, T+Zn, and T+ZDD. (J–L) Immunophenotyping of PD-1+ CD4+ T cells, PD-1+ CD8+ T cells, and PD-1+ γδTCR+ T cells from the TILs of T, T+Zn, and T+ZDD. (M) Schematic representation of the experiment in which B16F10 melanoma was implanted in C57BL/6 mice and clioquinol (CQ) dose was given (i.p.) as a therapy every alternative day starting from day 2 until the tumor volume reached 2,000 mm3. (N) The rate of growth of tumor volume in the groups of mice consuming a normal diet (T), high Zn intake (T+Zn), and a Zn-deficient diet (T+ZDD) and undergoing CQ treatment of 5 mg/kg [T+CQ (5 mg/kg)], 10 mg/kg [T+CQ (10 mg/kg)], and 25 mg/kg [T+CQ (25 mg/kg)]. (O) The endpoint tumor mass in T, T+Zn, T+ZDD, T+CQ (5 mg/kg), T+CQ (10 mg/kg), and T+CQ (25 mg/kg). (P) Percent survival curve of the B16F10 melanoma-bearing group of mice consuming a normal diet (T), high Zn intake (T+Zn), and a Zn-deficient diet (T+ZDD) and undergoing CQ` treatment of 25 mg/kg [T+CQ (25 mg/kg)]. (Q) Immunophenotyping of Foxp3+ Treg cells from the TILs of B16F10 melanoma-bearing C57BL/6 mice consuming a normal diet (T) and a high Zn intake (T+Zn) and undergoing CQ treatment of 25 mg/kg [T+CQ (25 mg/kg)]. Data are representative of the mean ± SEM from three independent experiments. *P < 0.05, **P < 0.01, ***P < 0.001, and ****P < 0.0001 (Student’s t-test or one-way ANOVA); percent survival by the Mantel–Cox test; number of animals (n = 7) in all experiments.
Figure 4
Figure 4
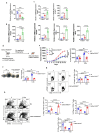
High Zn intake induces tumor progression through regulatory T cells (Tregs). (A) Schematic representation of the experiment in which B16F10 melanoma was implanted in FOXP3-GFP-DTR mice and these mice were given diphtheria toxin (DT) (10 μg/kg) doses for the targeted depletion of Treg cells. (B) The rate of growth of tumor volume in the groups of mice consuming a normal diet (T) and a high Zn intake (T+Zn), with or without Foxp3 ablation. (C) The tumor mass in the groups of mice consuming a normal diet (T) and a high Zn intake (T+Zn), with or without Foxp3 ablation. (D) Immunophenotyping of Foxp3+ Treg cells from the tumor-infiltrated lymphocytes (TILs) of B16F10 melanoma-bearing Foxp3-GFP-DTR mice consuming a normal diet (T) and a high Zn intake (T+Zn), with or without Foxp3 ablation. (E) Immunophenotyping of IFN-γ+ TNF-α+ CD4+ T (Th1) cells from the TILs of T and T+Zn, with or without Foxp3 ablation. (F) Immunophenotyping of PD-1+ CD4+ T cells from the TILs of T and T+Zn, with or without Foxp3 ablation. (G) Immunophenotyping of PD-1+ CD8+ T cells from the TILs of T and T+Zn, with or without Foxp3 ablation. (H) Immunophenotyping of PD-1+ γδTCR+ T cells from the TILs of T and T+Zn, with or without Foxp3 ablation. Data are representative of the mean ± SEM from three independent experiments. *P < 0.05, **P < 0.01, ***P < 0.001, and ****P < 0.0001 (Student’s t-test or one-way ANOVA); number of animals (n = 7) in all experiments.
Figure 5
Figure 5
FOXO1 plays a major role in Zn-mediated regulation of Treg cells. (A) The relative mRNA expression level of SIRT1 in tumor-infiltrated lymphocytes (TILs) of B16F10 melanoma-bearing C57BL/6 mice consuming a normal diet (T), a Zn supplement (T+Zn), and a Zn-deficient diet (T+ZDD). (B) The relative mRNA expression level of the FOXO1 gene in TILs of T, T+Zn, and T+ZDD. (C) The relative mRNA expression level of Foxp3 and its characteristic cofactors in the TILs of T, T+Zn, and T+ZDD. (D) Schematic representation of the experiment in which B16F10 melanoma was implanted in CD4 conditional FOXO1-deficient (Foxo1fl/flCD4Cre+) mice and C57BL/6 mice (wild-type, Wt). (E) The rate of growth of tumor volume in the groups of mice consuming a normal diet (T) and a high Zn intake (T+Zn) in the Wt group vs. the Cd4CreFOXO1f/f group. (F) The tumor mass in the groups of mice consuming a normal diet (T) and a high Zn intake (T+Zn) in the Wt group vs. the Cd4CreFOXO1f/f group. (G) Immunophenotyping of Foxp3+ Treg cells (regulatory T cells) from the TILs of the B16F10 melanoma-bearing Wt group and the Cd4CreFOXO1f/f group consuming a normal diet (T) and a high Zn intake (T+Zn). (H) Immunophenotyping of IFN-γ+ TNF-α+ CD4+ T (Th1) cells from the TILs of the Wt group and the Cd4CreFOXO1f/f group consuming a normal diet (T) and a high Zn intake (T+Zn). Data are representative of the mean ± SEM from three independent experiments. *P < 0.05, **P < 0.01, ***P < 0.001, and ****P < 0.0001 (Student’s t-test or one-way ANOVA); number of animals (n = 7) in all experiments.
Figure 6
Figure 6
Clioquinol (CQ) can enhance α-PD-1 immunotherapy in melanoma. (A) Schematic representation of the experiment in which B16F10 melanoma was implanted in C57BL/6 mice of which one of the groups was given a high Zn diet while the other group was kept on a normal laboratory diet. Both groups were treated with an optimal dose of α-PD-1 mAb (10 mg/kg). (B) The rate of growth of tumor volume in groups of C57BL/6 mice consuming a normal diet (T) and a high Zn intake (T+Zn), which are given isotype or α-PD-1 mAb treatment. (C) The tumor mass in T and T+Zn, which are given isotype or α-PD-1 mAb treatment. (D) Immunophenotyping of Foxp3+ Treg cells (regulatory T cells) from the tumor-infiltrated lymphocytes (TILs) of B16F10 melanoma-bearing C57BL/6 mice consuming a normal diet (T) and a high Zn intake (T+Zn), which are given isotype or α-PD-1 mAb treatment. (E) Schematic representation of the experiment in which B16F10 melanoma was implanted in C57BL/6 mice, which were treated with a combination therapy of a suboptimal dose of α-PD-1 mAb (5 mg/kg) and a suboptimal dose of CQ (10 mg/kg) until the endpoint tumor volume reached 2,000 mm3. (F) The rate of growth of tumor volume in groups of C57BL/6 mice bearing B16F10 melanoma, with the tumor-only control group (T) treated with a suboptimal dose of α-PD-1 mAb (T+α-PD-1), treated with a suboptimal dose of CQ (T+CQ), and treated with a combination of a suboptimal dose of α-PD-1 mAb and a suboptimal dose of CQ (T+α-PD-1+CQ). (G) The tumor mass of groups T, T+α-PD-1, T+CQ, and T+α-PD-1+CQ. (H) Immunophenotyping of Foxp3+ Treg cells (regulatory T cells) from the tumor-infiltrated lymphocytes (TILs) of groups T, T+α-PD-1, T+CQ, and T+α-PD-1+CQ. (I) Immunophenotyping of IFN-γ+ TNF-α+ CD4+ T (Th1) cells from the TILs of groups T, T+α-PD-1, T+CQ, and T+α-PD-1+CQ. (J) Immunophenotyping of PD-1+ CD4+ T cells from the TILs of groups T, T+α-PD-1, T+CQ, and T+α-PD-1+CQ. (K) Immunophenotyping of PD-1+ γδTCR+ T cells from the TILs of groups T, T+α-PD-1, T+CQ, and T+α-PD-1+CQ. Data are representative of the mean ± SEM from three independent experiments. *P < 0.05, **P < 0.01, ***P < 0.001, and ****P < 0.0001 (Student’s t-test or one-way ANOVA); number of animals (n = 7) in all experiments.

Similar articles

References

    1. Chen S, Cao Z, Prettner K, Kuhn M, Yang J, Jiao L, et al. . Estimates and projections of the global economic cost of 29 cancers in 204 countries and territories from 2020 to 2050. JAMA Oncol vol. (2023) 9:465–72. doi: 10.1001/jamaoncol.2022.7826 - DOI - PMC - PubMed
    1. Anderson KG, Stromnes IM, Greenberg PD. Obstacles posed by the tumor microenvironment to T cell activity: A case for synergistic therapies. Cancer Cell. (2017) 31:311–25. doi: 10.1016/j.ccell.2017.02.008 - DOI - PMC - PubMed
    1. Debela DT, Muzazu SG, Heraro KD, Ndalama MT, Mesele BW, Haile DC, et al. . New approaches and procedures for cancer treatment: Current perspectives. SAGE Open Med. (2021) 9:20503121211034366. doi: 10.1177/20503121211034366 - DOI - PMC - PubMed
    1. Waldman AD, Fritz JM, Lenardo MJ. A guide to cancer immunotherapy: from T cell basic science to clinical practice. Nat Rev Immunol. (2020) 20:651–68. doi: 10.1038/s41577-020-0306-5 - DOI - PMC - PubMed
    1. Dagar G, Gupta A, Masoodi T, Nisar S, Merhi M, Hashem S, et al. . Harnessing the potential of CAR-T cell therapy: progress, challenges, and future directions in hematological and solid tumor treatments. J Transl Med. (2023) 21:449. doi: 10.1186/s12967-023-04292-3 - DOI - PMC - PubMed

MeSH terms

Grants and funding

The author(s) declare financial support was received for the research, authorship, and/or publication of this article. The project was financially supported by Department of Biotechnology, Govt. of India, National Bioscience award by DBT and THSTI intramural grant.

LinkOut - more resources