. 2024 Sep 7;81(1):386.
doi: 10.1007/s00018-024-05370-5.

Human coronaviruses activate and hijack the host transcription factor HSF1 to enhance viral replication

Affiliations

Human coronaviruses activate and hijack the host transcription factor HSF1 to enhance viral replication

Silvia Pauciullo et al. Cell Mol Life Sci. .

Abstract

Organisms respond to proteotoxic-stress by activating the heat-shock response, a cellular defense mechanism regulated by a family of heat-shock factors (HSFs); among six human HSFs, HSF1 acts as a proteostasis guardian regulating severe stress-driven transcriptional responses. Herein we show that human coronaviruses (HCoV), both low-pathogenic seasonal-HCoVs and highly-pathogenic SARS-CoV-2 variants, are potent inducers of HSF1, promoting HSF1 serine-326 phosphorylation and triggering a powerful and distinct HSF1-driven transcriptional-translational response in infected cells. Despite the coronavirus-mediated shut-down of the host translational machinery, selected HSF1-target gene products, including HSP70, HSPA6 and AIRAP, are highly expressed in HCoV-infected cells. Using silencing experiments and a direct HSF1 small-molecule inhibitor we show that, intriguingly, HCoV-mediated activation of the HSF1-pathway, rather than representing a host defense response to infection, is hijacked by the pathogen and is essential for efficient progeny particles production. The results open new scenarios for the search of innovative antiviral strategies against coronavirus infections.

Keywords: HCoV-229E; HCoV-NL63; HCoV-OC43; Heat shock response; Protein homeostasis; SARS-CoV-2.


Conflict of interest statement

The authors declare no conflict of interest.

Figures
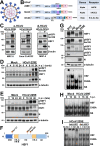
Fig. 1
Fig. 1
Human coronaviruses induce HSF1 phosphorylation and DNA-binding activity. A The human coronavirus lipid bilayer comprising the spike protein (blue), the membrane protein (orange) and the envelope protein (green), and the viral RNA (purple) associated with the nucleocapsid protein (pink) are shown. B Schematic representation of genome structure, classification and receptors of the human coronaviruses HCoV-229E, HCoV-NL63 and HCoV-OC43. ORF1a and ORF1b are represented as light blue boxes; genes encoding structural proteins spike (S), nucleocapsid (N), envelope (E), membrane (M), and hemagglutinin-esterase (HE) and genes encoding accessory proteins are shown. hAPN, human aminopeptidase N; 9-O-Ac-Sia, N-acetyl-9-O-acetylneuraminic acid; ACE2, angiotensin-converting enzyme 2. C Immunoblot (IB) analysis of pHSF1-Ser326, HSF1, viral nucleocapsid (N) and β-actin protein levels in MRC-5 and Caco-2 hACE2 cells mock-infected (−) or infected (+) with HCoV-229E or HCoV-OC43 (MRC-5) for 24 h, or HCoV-NL63 (Caco-2 hACE2) for 72 h at a m.o.i. of 0.1 TCID50/cell. D, E Whole-cell extracts (WCE) from samples mock-infected (Mock) or infected with HCoV-229E (1 TCID50/cell) were analyzed for pHSF1-Ser326, HSF1, N and α-tubulin protein levels at early (D) or late (E) times post infection (p.i.) by IB. F Schematic representation of HSF1 domain organization: DBD, DNA Binding Domain; HR-A/HR-B, Heptad Repeats A and B; RD, Regulatory Domain; HR-C, Heptad Repeat C; AD, Activation Domain. Phosphorylation sites Ser121, Ser303, and Ser326 are shown. G MRC-5 cells were treated with bortezomib (BTZ, 20 nM) for 16 h, exposed to heat stress (HS, 43 °C, 40 min), mock-infected (Mock) or infected with HCoV-229E (0.1 TCID50/cell) for 40 h. WCE were analyzed for levels of HSF1-Ser326, -Ser303 and -Ser121 phosphorylation, HSF1, viral N and α-tubulin proteins by IB (top panels). In the same samples, HSF1 DNA-binding activity was analyzed by EMSA (bottom panel). Positions of the HSF DNA-binding complex (HSF), constitutive HSE-binding activity (CHBA) and nonspecific protein-DNA interaction (NS) are shown. H MRC-5 cells were mock-infected or infected with HCoV-229E (1 TCID50/cell). At different times p.i., HSF1 DNA-binding activity was analyzed by EMSA. I WCE from samples infected with HCoV-229E (0.1 TCID50/cell, 40 h p.i.) were preincubated with different dilutions of anti-HSF1 or anti-HSF2 antibodies and analyzed by gel mobility supershift assay. The position of the nonsupershifted virus-induced HSF1 complex is indicated at the left (No Ab)
Fig. 2
Fig. 2
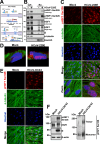
HCoV infection triggers HSF1 nuclear translocation in human lung cells. A Schematic representation of HSF1 intracellular localization under physiological (no stress) and stress conditions. B Immunoblot analysis of pHSF1-Ser326, HSF1 and viral spike (S) protein levels in cytoplasmic (Cyt) and nuclear (Nu) fractions of MRC-5 cells mock-infected (−) or infected (+) with HCoV-229E (0.1 TCID50/cell) for 24 h. Antibodies against α-tubulin and histone H3 (Hist-H3) were used as loading controls for cytoplasmic and nuclear fractions, respectively. C Confocal images of pHSF1-Ser326 (red) and α-tubulin (green) intracellular localization in MRC-5 cells mock-infected or infected with HCoV-229E (1 TCID50/cell) at 30 h p.i.. Nuclei are stained with Hoechst (blue). Merge and zoom images are shown. Scale bar, 20 μm (zoom, 5 μm). D Confocal 3D-reconstruction of pHSF1-Ser326 (red) intranuclear localization in MRC-5 cells mock-infected or infected as in C; α-tubulin is shown in green. Nuclei are stained with Hoechst (blue). The overlay of the fluorochromes is shown. E Confocal images of pHSF1-Ser326 (red) and α-tubulin (green) intracellular localization in MRC-5 cells mock-infected or infected with HCoV-OC43 (1 TCID50/cell) at 30 h p.i.. Nuclei are stained with Hoechst (blue). Merge images are shown. Scale bar, 20 μm. F IB of pHSF1-Ser326, HSF1, N and β-actin protein levels in MRC-5 cells mock-infected or infected with HCoV-OC43 (0.1 TCID50/cell) for 24 h (left panels). HSF1 monomers and trimers in the same samples are shown (right panel)
Fig. 3
Fig. 3
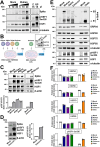
HCoV infection turns on an HSF1-driven transcriptional program in human lung cells. AD Expression profile of selected HSF1-target genes affected by HCoV-229E infection (0.1 TCID50/cell) for 24 h in MRC-5 cells relative to mock-infected cells as determined by qRT-PCR array (PAHS-076ZD-2-Qiagen). Heat Map (A) and Volcano plot (B) of 84 human HSPs and chaperones/cochaperones gene expression. In A each row represents a single gene, each column represents a sample [mock-infected or HCoV-229E infected cells (229E); n = 3]. The gradual color ranging from blue to red represents the mRNA expression level (Z-score). In the Volcano plot (B) fold regulation threshold is set to 2 and p-value cut off is 0.05; each dot represents a gene: red dots indicate significantly upregulated genes and blue dots indicate significantly downregulated genes. Selected HSPs and chaperones/cochaperones genes whose expression is highly induced by HCoV infection are shown in C; levels of heat shock factors (HSF1, HSF2 and HSF4) gene expression affected by HCoV infection are shown in D. E Expression of non-canonical HSF1-target genes AIRAP, COX-2 and NKRF in samples treated as in A as determined by qRT-PCR. Error bars indicate means ± S.D. (n = 3). *p < 0.05; Student’s t-test (D, E). F Levels of HSP90, GRP94, GRP78, HSP70, HSPA6, HSP60, AIRAP, viral spike (S) and β-actin proteins were determined by IB in MRC-5 cells mock-infected or infected with HCoV-229E (1 TCID50/cell) at different times p.i.. G Schematic representation of the puromycin-labeling experimental protocol. H MRC-5 cells were mock-infected (−) or infected with HCoV-229E (+) (1 TCID50/cell), or treated with vehicle (−) or cycloheximide (CHX, 100 µg/ml, +) for 3 h, as positive control of translation inhibition. At different times p.i., puromycin (2.5 µg/ml, +) was added thirty minutes before harvesting and IB analysis. Blot membranes were stained with Ponceau S solution to assess the steady-state proteomes (top panel) and then hybridized with anti-puromycin antibodies to detect de novo synthesized nascent polypeptides (middle panel). HCoV-N protein is indicated by red arrowheads. Levels of GRP94, GRP78, HSP70, HCoV-N and β-actin proteins detected by IB in the same samples are shown (bottom panels)
Fig. 4
Fig. 4
Effect of different SARS-CoV-2 variants on HSF1 activation and HSP70 expression in the host cell. A Immunoblot analysis of SARS-CoV-2 viral spike, pHSF1-Ser326, HSF1 and α-tubulin protein levels in Vero-hACE2-TMPRSS2 cells mock-infected or infected for 48 h with SARS-CoV-2 Wuhan strain (0.1 PFU/cell), or in Vero E6 cells exposed to heat-stress (HS, 43 °C, 40 min). B Schematic representation of the experimental design of SARS-CoV-2 variants infection of Vero-hACE2-TMPRSS2 or MRC5-hACE2 cells. Immunoblot analysis of human angiotensin-converting enzyme 2 (hACE2) protein levels in MRC-5 wild type or expressing the human ACE2-receptor (M-hACE2) is shown. C Vero-hACE2-TMPRSS2 cells were mock-infected or infected with Wuhan, Alpha, Delta (0.1 PFU/cell) or Omicron (0.5 PFU/cell) SARS-CoV-2 variants for 48 h. Equal amounts of whole-cell extracts (10 μl) were analyzed for levels of spike, HSF1-Ser326, HSF1 and β-actin by IB (top panels). The pHSF1/HSF1 ratio was determined after normalizing to β-actin and expressed as fold induction of the mock-infected control, which was arbitrarily set to 1 (bottom panel). D MRC5-hACE2 cells were mock-infected or infected with the SARS-CoV-2 Omicron BA.1 variant (0.1 PFU/cell) for 24 h. Equal amounts of whole-cell extracts (15 μl) were analyzed for levels of spike, HSF1-Ser326, HSF1 and β-actin (left panels). The pHSF1/HSF1 ratio was determined after normalizing to β-actin and expressed as fold induction of the mock-infected control, which was arbitrarily set to 1 (right panel). E, F Vero-hACE2-TMPRSS2 cells were mock-infected or infected with different SARS-CoV-2 variants as in C. Equal amounts of whole-cell extracts (20 μl) were analyzed for levels of spike, GRP94, HSP90, HSP70, HSP60, pHSF1-Ser326, HSF1 and α-tubulin by IB (E). Uncleaved S proteins (S0) and S1 subunits are indicated by arrows. Relative amounts of GRP94, HSP90, HSP70, HSP60 and pHSF1 were determined after normalizing to α-tubulin and expressed as fold induction of the mock-infected control, which was arbitrarily set to 1 (F). C, D, F n = 4 (two technical replicates over two biological replicates)
Fig. 5
Fig. 5
HSF1 is required for efficient HCoV replication. A Immunoblot of pHSF1-Ser326, HSF1, AIRAP, viral spike (S), α-tubulin and GAPDH protein levels in MRC-5 cells transiently transfected with two different HSF1-siRNAs [siHSF11 (left) and siHSF12 (right); +] or scramble-RNA (−) for 48 h, and infected with HCoV-229E (0.1 TCID50/cell) or mock infected (Mock) for 24 h. B The relative amount of total HSF1, AIRAP and viral S protein, normalized to the loading control in the same sample, were determined by densitometric analysis using ImageJ software. Error bars indicate means ± S.D. (n = 3). C In parallel, virus yield from supernatants of infected cells was determined at 24 h p.i. by TCID50 infectivity assay. Data, expressed as percentage of control, represent the mean ± S.D. (n = 3). *p < 0.05, **p < 0.01; Student’s t-test (B, C). D Schematic representation of HCoV genomic RNA transfection assays. E–H Wild-type (wt) or stably HSF1-silenced (HSF1i) HeLa cells were co-transfected with HCoV-229E (229E gRNA) or HCoV-OC43 (OC43 gRNA) genomic RNA and the pCMV-GFP vector for 4 h. After 48 h (229E) or 72 h (OC43), levels of HSF1, viral spike (S) and nucleocapsid (N), GFP and GAPDH proteins were analyzed by IB (E, G). In parallel, virus yield in the supernatant of transfected cells was determined by TCID50 infectivity assay (F, H). Data, expressed as TCID50/ml, represent the mean ± S.D. (n = 3). *p < 0.05; Student’s t-test
Fig. 6
Fig. 6
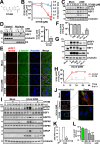
Inhibition of virus-induced HSF1 activation by DTHIB impairs HCoV replication. A Structure of DTHIB (Direct Targeted HSF1 Inhibitor). B MRC-5 cells mock-infected or infected with HCoV-229E (0.1 TCID50/cell) were treated with different concentrations of DTHIB immediately after the adsorption period. Virus yield (Ο) was determined at 24 h p.i. by TCID50 infectivity assay. Data, expressed as TCID50/ml, represent the mean ± S.D. (n = 4). *p < 0.05, **p < 0.01; ANOVA test. In parallel, cell viability (△) was determined in mock-infected cells by MTT assay. Absorbance (O.D.) of converted dye was measured at λ = 570 nm. C Immunoblot of pHSF1-Ser326, HSF1, viral N and α-tubulin protein levels in samples treated as in B. D Immunoblot analysis of HSF1 levels in cytoplasmic (Cytosol) and nuclear (Nucleus) fractions of MRC-5 cells mock-infected (−) or infected ( +) with HCoV-229E (0.1 TCID50/cell) for 24 h and treated with DTHIB (10 µM, +) or vehicle (−) immediately after the adsorption period (left panels). Antibodies against α-tubulin and Histone H3 (H3) were used as a loading control for cytoplasmic and nuclear fractions, respectively. Virus yield was determined at 24 h p.i. by TCID50 infectivity assay (right panel). Data, expressed as TCID50/ml, represent the mean ± S.D. (n = 4). *p < 0.05; Student’s t-test. E Confocal images of pHSF1-Ser326 (red) and α-tubulin (green) intracellular localization in MRC-5 cells mock-infected or infected with HCoV-229E (1 TCID50/cell) for 30 h and treated with DTHIB (5 µM) or control diluent after the adsorption period. Nuclei are stained with Hoechst (blue). Merge images are shown. Scale bar, 20 µm. F MRC-5 cells mock-infected or infected with HCoV-229E (0.1 TCID50/cell) were treated with 10 μM DTHIB (filled bars) or control vehicle (C, empty bar) at 3 h before infection (PRE), immediately after the adsorption period (0 h), at 10 h after infection (10 h p.i.), or only during the adsorption period (ADS). Virus yield was determined at 24 h p.i. by TCID50 assay. Data, expressed as TCID50/ml, represent the mean ± S.D. (n = 3). *p < 0.05; ANOVA test. G Immunoblot of pHSF1-Ser326, HSF1, AIRAP, HCoV-N and α-tubulin protein levels of samples treated as in F. H, I MRC-5 cells were mock-infected or infected with HCoV-229E (1 TCID50/cell) and treated with DTHIB (7.5 µM). At different times p.i., virus yield was determined by TCID50 infectivity assay. Data, expressed as TCID50/ml, represent the mean ± S.D. (n = 3). *p < 0.05, **p < 0.01; Student’s t-test (H). In parallel, levels of pHSF1-Ser326, HSF1, HSP70, HSPA6, HSP60, AIRAP, HCoV-N and α-tubulin proteins were determined by IB (I). J Confocal images of viral nucleoprotein (red) and dsRNA (green) intracellular localization in MRC-5 cells infected with HCoV-229E (1 TCID50/cell) for 30 h and treated with DTHIB (5 µM) or control diluent immediately after the adsorption period. Nuclei are stained with Hoechst (blue). Merge and zoom images are shown. Scale bar, 20 µm (zoom, 7 µm). K Levels of M-229E mRNA were analyzed by qRT-PCR in samples treated as in J. Error bars indicate means ± S.D. (n = 3). *p < 0.05; Student’s t-test. L MRC5-hACE2 cells infected with SARS-CoV-2 Omicron BA.1 variant (0.1 PFU/cell) were treated with different concentrations of DTHIB immediately after the adsorption period. Virus yield was determined at 22 h p.i. by plaque assay. Data, expressed as PFU/ml, represent the mean ± S.D. of samples from three independent experiments. ***p < 0.001; **p < 0.01; ANOVA test

Similar articles

References

    1. Labbadia J, Morimoto RI (2015) The biology of proteostasis in aging and disease. Annu Rev Biochem 84:435–464. 10.1146/annurev-biochem-060614-033955 10.1146/annurev-biochem-060614-033955 - DOI - PMC - PubMed
    1. Lindquist S, Craig EA (1988) The heat-shock proteins. Annu Rev Genet 22:631–677. 10.1146/annurev.ge.22.120188.003215 10.1146/annurev.ge.22.120188.003215 - DOI - PubMed
    1. Morimoto RI, Santoro MG (1998) Stress-inducible responses and heat shock proteins: new pharmacologic targets for cytoprotection. Nat Biotechnol 16:833–838. 10.1038/nbt0998-833 10.1038/nbt0998-833 - DOI - PubMed
    1. Akerfelt M, Morimoto RI, Sistonen L (2010) Heat shock factors: integrators of cell stress, development and lifespan. Nat Rev Mol Cell Biol 11:545–555. 10.1038/nrm2938 10.1038/nrm2938 - DOI - PMC - PubMed
    1. Gomez-Pastor R, Burchfiel ET, Thiele DJ (2018) Regulation of heat shock transcription factors and their roles in physiology and disease. Nat Rev Mol Cell Biol 19:4–19. 10.1038/nrm.2017.73 10.1038/nrm.2017.73 - DOI - PMC - PubMed

Substances

LinkOut - more resources