

AutoFocus: a hierarchical framework to explore multi-omic disease associations spanning multiple scales of biomolecular interaction
- PMID: 39237774
- PMCID: PMC11377741
- DOI: 10.1038/s42003-024-06724-2
AutoFocus: a hierarchical framework to explore multi-omic disease associations spanning multiple scales of biomolecular interaction
Abstract
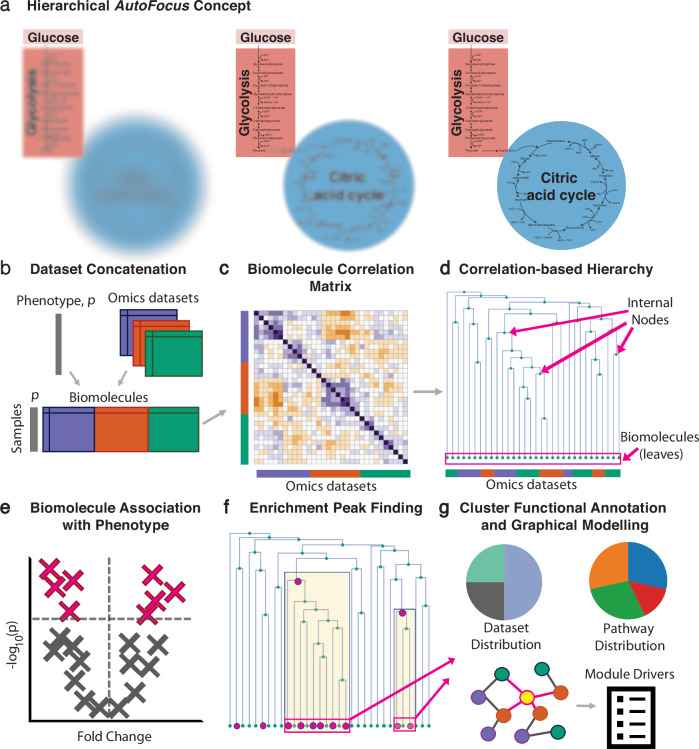
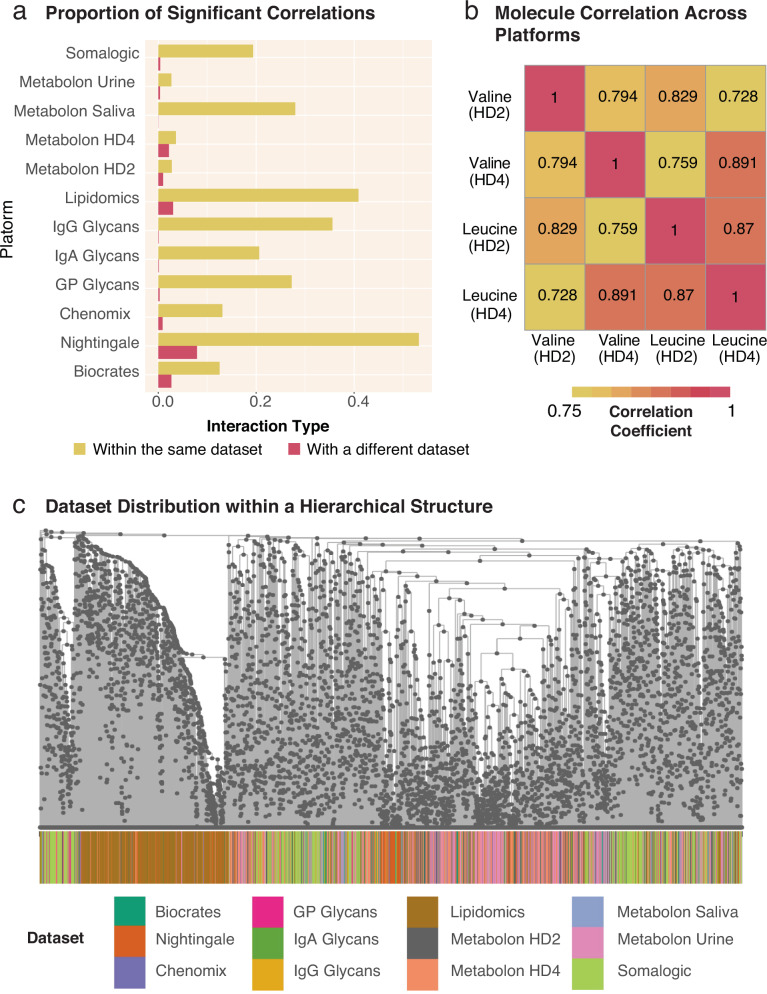
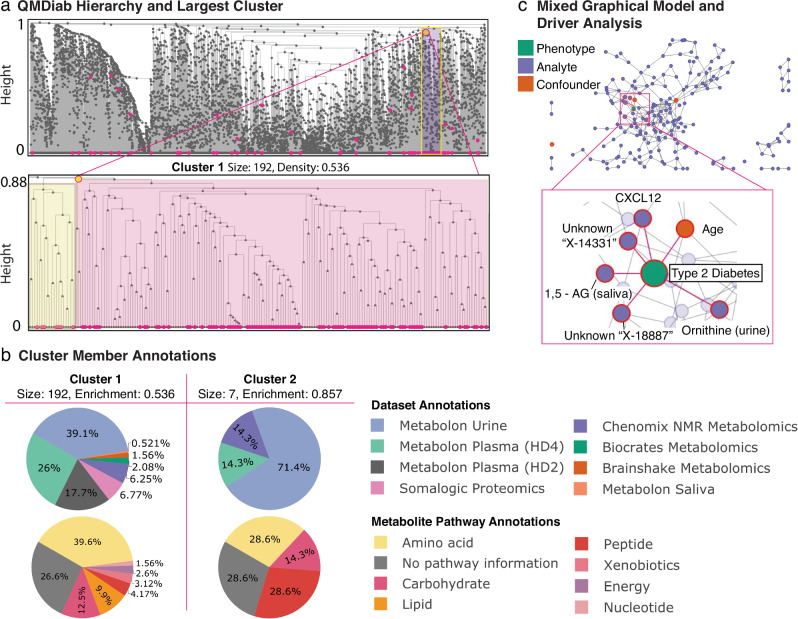
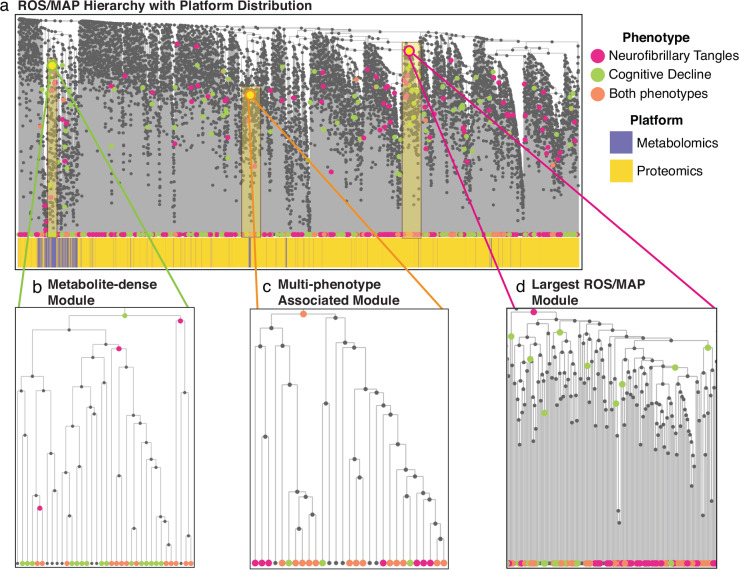
Recent advances in high-throughput measurement technologies have enabled the analysis of molecular perturbations associated with disease phenotypes at the multi-omic level. Such perturbations can range in scale from fluctuations of individual molecules to entire biological pathways. Data-driven clustering algorithms have long been used to group interactions into interpretable functional modules; however, these modules are typically constrained to a fixed size or statistical cutoff. Furthermore, modules are often analyzed independently of their broader biological context. Consequently, such clustering approaches limit the ability to explore functional module associations with disease phenotypes across multiple scales. Here, we introduce AutoFocus, a data-driven method that hierarchically organizes biomolecules and tests for phenotype enrichment at every level within the hierarchy. As a result, the method allows disease-associated modules to emerge at any scale. We evaluated this approach using two datasets: First, we explored associations of biomolecules from the multi-omic QMDiab dataset (n = 388) with the well-characterized type 2 diabetes phenotype. Secondly, we utilized the ROS/MAP Alzheimer's disease dataset (n = 500), consisting of high-throughput measurements of brain tissue to explore modules associated with multiple Alzheimer's Disease-related phenotypes. Our method identifies modules that are multi-omic, span multiple pathways, and vary in size. We provide an interactive tool to explore this hierarchy at different levels and probe enriched modules, empowering users to examine the full hierarchy, delve into biomolecular drivers of disease phenotype within a module, and incorporate functional annotations.
© 2024. The Author(s).
Conflict of interest statement
The authors declare the following competing interests: J.K. holds equity in Chymia LLC, owns intellectual property in PsyProtix, serves as an advisor for celeste, and is a co-founder of iollo. R.K-D. in an inventor on a series of patents on use of metabolomics for the diagnosis and treatment of CNS diseases and holds equity in Metabolon Inc., Chymia LLC and PsyProtix.
Figures
Similar articles
-
Dynamic Field Theory of Executive Function: Identifying Early Neurocognitive Markers.Monogr Soc Res Child Dev. 2024 Dec;89(3):7-109. doi: 10.1111/mono.12478. Monogr Soc Res Child Dev. 2024. PMID: 39628288 Free PMC article.
-
Depressing time: Waiting, melancholia, and the psychoanalytic practice of care.In: Kirtsoglou E, Simpson B, editors. The Time of Anthropology: Studies of Contemporary Chronopolitics. Abingdon: Routledge; 2020. Chapter 5. In: Kirtsoglou E, Simpson B, editors. The Time of Anthropology: Studies of Contemporary Chronopolitics. Abingdon: Routledge; 2020. Chapter 5. PMID: 36137063 Free Books & Documents. Review.
-
On the objectivity, reliability, and validity of deep learning enabled bioimage analyses.Elife. 2020 Oct 19;9:e59780. doi: 10.7554/eLife.59780. Elife. 2020. PMID: 33074102 Free PMC article.
-
Enabling Systemic Identification and Functionality Profiling for Cdc42 Homeostatic Modulators.bioRxiv [Preprint]. 2024 Jan 8:2024.01.05.574351. doi: 10.1101/2024.01.05.574351. bioRxiv. 2024. Update in: Commun Chem. 2024 Nov 19;7(1):271. doi: 10.1038/s42004-024-01352-7. PMID: 38260445 Free PMC article. Updated. Preprint.
-
Conservative, physical and surgical interventions for managing faecal incontinence and constipation in adults with central neurological diseases.Cochrane Database Syst Rev. 2024 Oct 29;10(10):CD002115. doi: 10.1002/14651858.CD002115.pub6. Cochrane Database Syst Rev. 2024. PMID: 39470206
References
-
- Palsson, B. & Zengler, K. The challenges of integrating multi-omic data sets. Nat. Chem. Biol.6, 10.1101/gr.107540.110 (2010). - PubMed
Publication types
MeSH terms
Grants and funding
- U19AG063744/U.S. Department of Health & Human Services | NIH | National Institute on Aging (U.S. National Institute on Aging)
- R01AG069901-01/U.S. Department of Health & Human Services | NIH | National Institute on Aging (U.S. National Institute on Aging)
- P30 AG010161/AG/NIA NIH HHS/United States
- R01 AG015819/AG/NIA NIH HHS/United States
- R01 AG017917/AG/NIA NIH HHS/United States
- R01 AG030146/AG/NIA NIH HHS/United States
- R01 AG036042/AG/NIA NIH HHS/United States
- RC2 AG036547/AG/NIA NIH HHS/United States
- R01 AG036836/AG/NIA NIH HHS/United States
- R01 AG048015/AG/NIA NIH HHS/United States
- RF1 AG057473/AG/NIA NIH HHS/United States
- U01 AG032984/AG/NIA NIH HHS/United States
- U01 AG046152/AG/NIA NIH HHS/United States
- U01 AG046161/AG/NIA NIH HHS/United States
- U01 AG061356/AG/NIA NIH HHS/United States
- R01 AG046171/AG/NIA NIH HHS/United States
- RF1 AG051550/AG/NIA NIH HHS/United States
- RF1 AG057452/AG/NIA NIH HHS/United States
- RF1 AG059093/AG/NIA NIH HHS/United States
- RF1 AG058942/AG/NIA NIH HHS/United States
- U01 AG061359/AG/NIA NIH HHS/United States
- U19 AG063744/AG/NIA NIH HHS/United States
LinkOut - more resources
Full Text Sources
Medical
Research Materials
