. 2024 Sep 5;81(1):385.
doi: 10.1007/s00018-024-05422-w.

PARVB deficiency alleviates cisplatin-induced tubular injury by inhibiting TAK1 signaling

Affiliations

PARVB deficiency alleviates cisplatin-induced tubular injury by inhibiting TAK1 signaling

Aihua Yang et al. Cell Mol Life Sci. .

Abstract

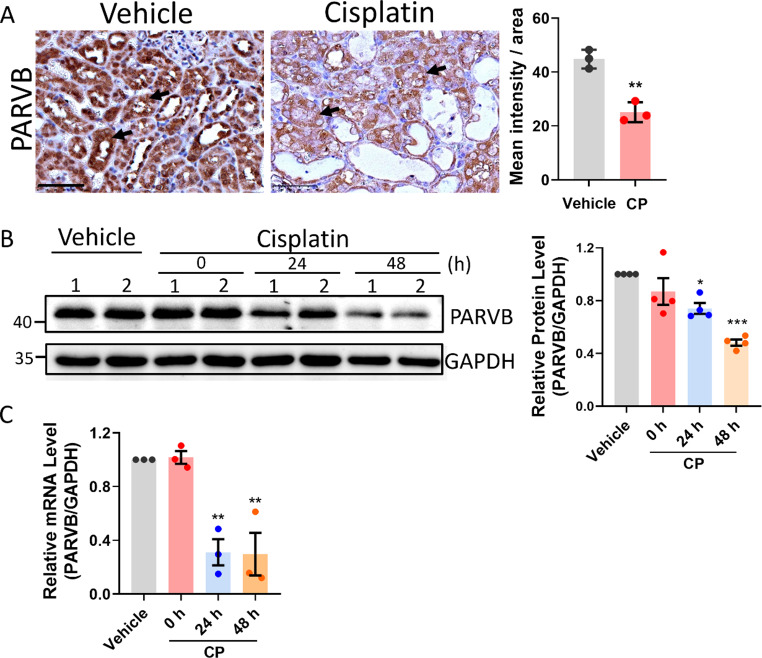
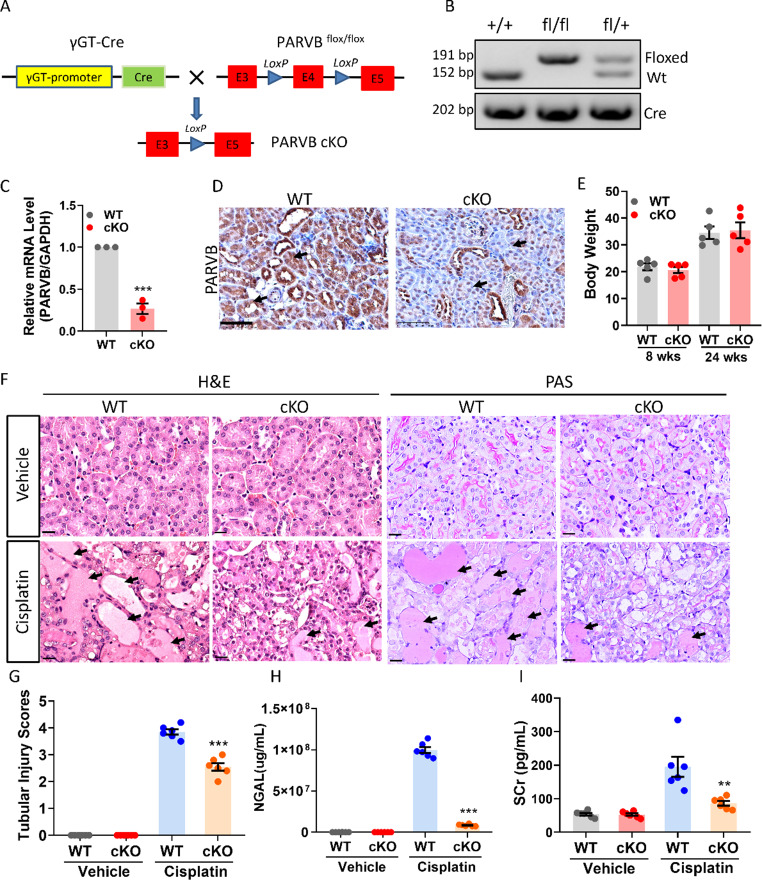
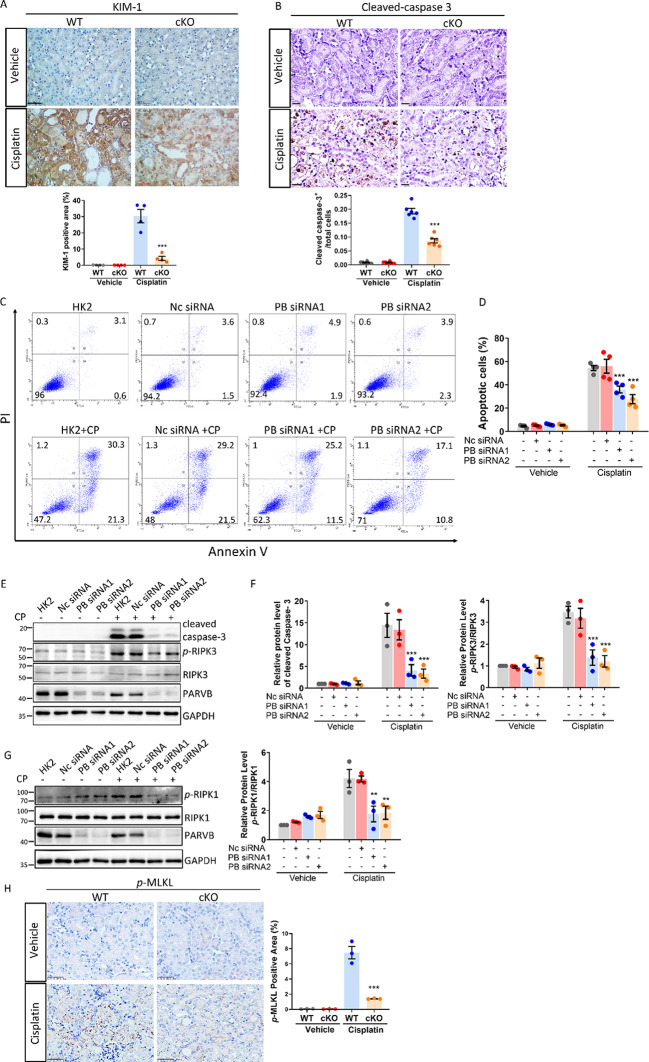
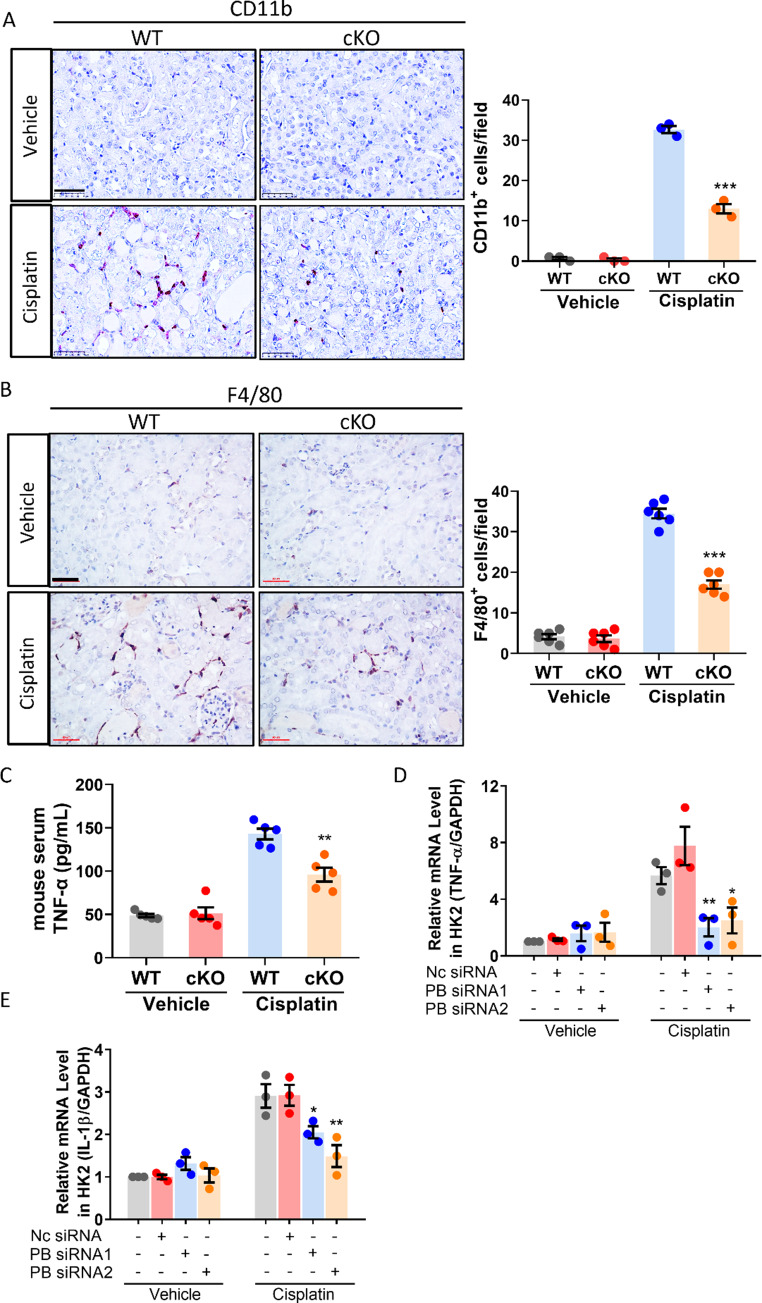
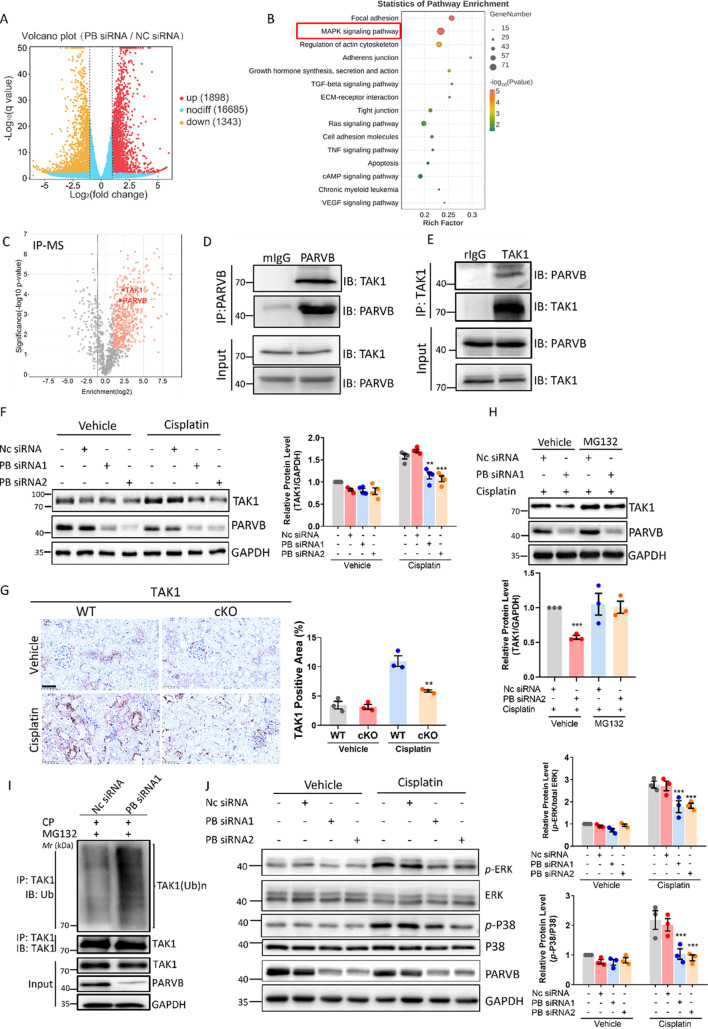
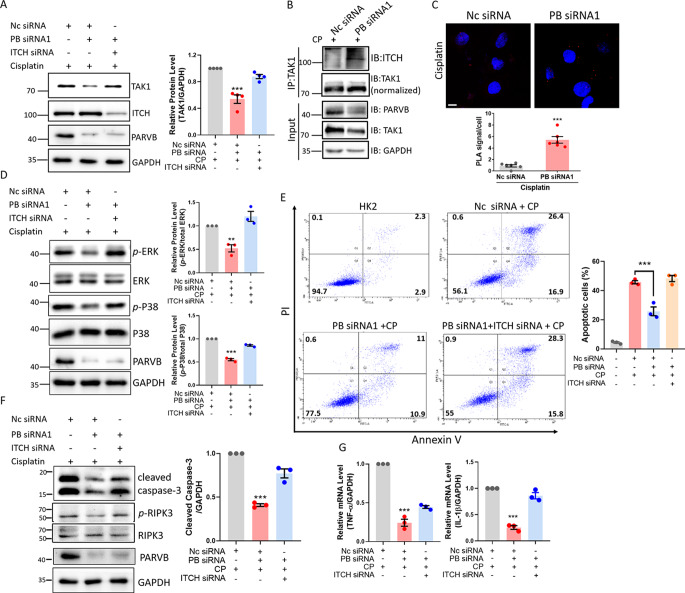
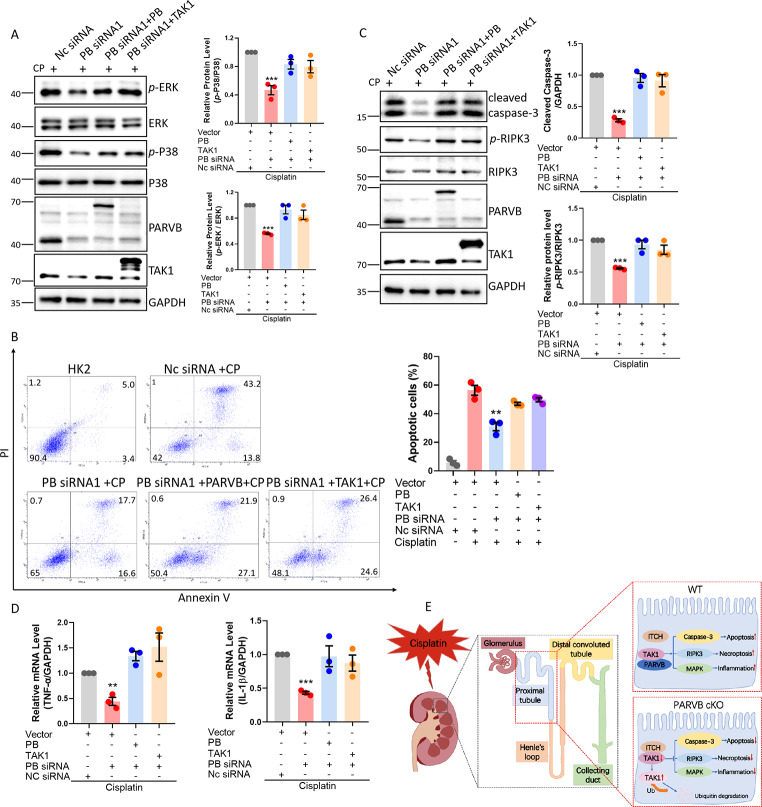
Cisplatin-induced renal tubular injury largely restricts the wide-spread usage of cisplatin in the treatment of malignancies. Identifying the key signaling pathways that regulate cisplatin-induced renal tubular injury is thus clinically important. PARVB, a focal adhesion protein, plays a crucial role in tumorigenesis. However, the function of PARVB in kidney disease is largely unknown. To investigate whether and how PARVB contributes to cisplatin-induced renal tubular injury, a mouse model (PARVB cKO) was generated in which PARVB gene was specifically deleted from proximal tubular epithelial cells using the Cre-LoxP system. In this study, we found depletion of PARVB in proximal tubular epithelial cells significantly attenuates cisplatin-induced renal tubular injury, including tubular cell death and inflammation. Mechanistically, PARVB associates with transforming growth factor-β-activated kinase 1 (TAK1), a central regulator of cell survival and inflammation that is critically involved in mediating cisplatin-induced renal tubular injury. Depletion of PARVB promotes cisplatin-induced TAK1 degradation, inhibits TAK1 downstream signaling, and ultimately alleviates cisplatin-induced tubular cell damage. Restoration of PARVB or TAK1 in PARVB-deficient cells aggravates cisplatin-induced tubular cell injury. Finally, we demonstrated that PARVB regulates TAK1 protein expression through an E3 ligase ITCH-dependent pathway. PARVB prevents ITCH association with TAK1 to block its ubiquitination. Our study reveals that PARVB deficiency protects against cisplatin-induced tubular injury through regulation of TAK1 signaling and indicates targeting this pathway may provide a novel therapeutic strategy to alleviate cisplatin-induced kidney damage.

Keywords: Beta-parvin; Cell death; Focal adhesion; ITCH; Inflammation; Kidney diseases.


Conflict of interest statement

The authors declare no competing financial interests.

Figures

Fig. 1
Fig. 1
PARVB expression is down-regulated in mouse tissues or human tubular cells treated with cisplatin. (A) Eight-week-old wild-type mice were treated with vehicle or cisplatin (15 mg/kg) for three days. Kidney sections from vehicle or cisplatin-treated mice were stained with antibodies against PARVB. Representative images and quantification analysis were shown. Scale bar, 50 μm. **P < 0.01 vs. Vehicle, n = 3 mice for each group. (B) Immunoblotting analysis of PARVB protein expression in HK2 cells treated with cisplatin at different time points (left panel). Quantification analysis was shown in the right panel. *P < 0.05, ***P < 0.001 vs. Vehicle. n = 4 independent experiments. (C) qPCR analysis of PARVB mRNA expression in HK2 cells treated with cisplatin at different time points. **P < 0.01 vs. Vehicle. n = 3 independent experiments
Fig. 2
Fig. 2
PARVB deficiency alleviates cisplatin-induced renal tubular injury in mice. (A) The diagram depicts the strategy for the generation of PARVB cKO mice. Mice expressing γ-GT1-Cre were crossed with mice carrying floxed PARVB locus (exon 4). (B) Representative PCR analysis of extracted genomic DNA from tail clippings. PCR product of floxed (191 bp) and wild-type (152 bp) were shown. Cre PCR product (202 bp) was also indicated. (C) qPCR analysis of PARVB mRNA expression in isolated primary tubular cells from wild-type mice (WT) and PARVB cKO mice (cKO). ***P < 0.001 vs. WT. n = 3 mice for each group. (D) Representative images of kidney sections stained with antibody against PARVB in WT and PARVB cKO mice Scale bar: 50 μm. (E) PARVB cKO mice showed no significant difference on body weight compared to WT mice at 8 and 24 weeks of age. n = 5 mice for each group. (F) Kidney sections from WT and PARVB cKO mice treated with vehicle or cisplatin (15 mg/kg) for three days were subjected to Haematoxylin and Eosin (H&E) or Periodic acid-Schiff (PAS) staining. Arrows indicated renal tubular dilatation and proteinaceous casts. Scale bar, 20 μm. (G) Quantification of renal histopathologic injury score in WT and PARVB cKO mice treated with or without cisplatin (15 mg/kg) for three days. ***P < 0.001 vs. WT + Cisplatin. n = 6 mice for each group. (H) Quantification of urinary Neutrophil gelatinase-associated lipocalin (NGAL) level in WT and PARVB cKO mice treated with or without cisplatin (15 mg/kg) for three days. ***P < 0.001 vs. WT + Cisplatin. n = 6 mice for each group. (I) Quantification of serum creatinine (SCr) in WT and PARVB cKO mice treated with or without cisplatin (15 mg/kg). **P < 0.01 vs. WT + Cisplatin. n = 6 mice for each group
Fig. 3
Fig. 3
PARVB deficiency attenuates cisplatin-induced renal cell death. (A) Representative images of kidney sections stained with antibody against KIM-1, a biomarker of renal tubular injury, in WT and PARVB cKO mice after cisplatin (15 mg/kg) or vehicle treatment. Scale bar: 20 μm. Quantification of the percentage of KIM-1 positive area was shown in the lower panel. ***P < 0.001 vs. WT + Cisplatin. n = 4 mice for each group. (B) Representative images of kidney sections stained with antibody against cleaved-caspase-3 in WT and PARVB cKO mice after cisplatin (15 mg/kg) or vehicle treatment. Scale bar: 10 μm. Quantification of the ratio of cleaved caspase-3-positive cell number to total cell number was shown in the lower panel. ***P < 0.001 vs. WT + Cisplatin. n = 6 mice for each group. (C) Flow cytometry analysis of the apoptotic cells in control (Nc siRNA) and PARVB knockdown (PB siRNA1 and PB siRNA2) HK2 cells with or without cisplatin (15 µM) treatment. CP, cisplatin. (D) Quantification analysis of (C) was shown. ***P < 0.001 vs. HK2 + Cisplatin, n = 4 independent experiments. (E) Immunoblotting analysis of the expression level of RIPK3, phosphorylated (p)-RIPK3 and cleaved-caspase-3 in control (Nc siRNA) and PARVB knockdown (PB siRNA1 and PB siRNA2) HK2 cells with or without cisplatin (15 µM) treatment. (F) Quantification analysis in (E) was shown. ***P < 0.001 vs. HK2 + Cisplatin. n = 3 independent experiments. (G) Immunoblotting analysis of the expression level of RIPK1, phosphorylated (p)-RIPK1 in control (Nc siRNA) and PARVB knockdown (PB siRNA1 and PB siRNA2) HK2 cells with or without cisplatin (15 µM) treatment. Quantification analysis was shown in the right panel. **P < 0.01 vs. HK2 + Cisplatin. n = 3 independent experiments. (H) Representative images of kidney sections stained with antibody against phosphorylated (p)-MLKL in WT and PARVB cKO mice after cisplatin (15 mg/kg) or vehicle treatment. Scale bar: 50 μm. Quantification of the percentage of p-MLKL positive area was shown in the right panel. ***P < 0.001 vs. WT + Cisplatin. n = 3 mice for each group
Fig. 4
Fig. 4
PARVB deficiency protects against cisplatin-induced renal inflammation. (A) Representative images of kidney sections stained with antibody against CD11b (a myeloid cell marker) in WT and PARVB cKO mice after cisplatin (15 mg/kg) or vehicle treatment. Scale bar: 50 μm. Quantification analysis was shown in the right panel. ***P < 0.001 vs. WT + Cisplatin. n = 3 mice for each group. (B) Representative images of kidney sections stained with antibody against F4/80 (a macrophage marker) in WT and PARVB cKO mice after cisplatin (15 mg/kg) or vehicle treatment. Scale bar: 20 μm. Quantification analysis was shown in the right panel. ***P < 0.001 vs. WT + Cisplatin. n = 6 mice for each group. (C) ELISA analysis of TNF-ɑ level in mouse serum isolated from WT or PARVB cKO mice with or without cisplatin (15 mg/kg) treatment. **P < 0.01 vs. WT + Cisplatin. n = 5 mice for each group. (D-E) qPCR analysis of TNF-ɑ(D) and IL-1β(E) mRNA expression in control (Nc siRNA) and PARVB knockdown (PB siRNA1 and PB siRNA2) HK2 cells with or without cisplatin (15 µM) treatment. *P < 0.05, **P < 0.01 vs. HK2 + Cisplatin, n = 3 independent experiments
Fig. 5
Fig. 5
PARVB promotes cisplatin-induced renal cell death and inflammation through regulation of TAK1 protein expression. (A) Volcano plot of differentially expressed genes in cells as indicated in the figure. (B) KEGG analysis of the enriched differentially expressed genes in control (Nc siRNA) and PARVB knockdown (PB siRNA1) HK2 cells treated with cisplatin (15 µM). KEGG, Kyoto Encyclopedia of Genes and Genomes. (C) Volcano plot showing PARVB association proteins identified using PARVB immunoprecipitation followed by Mass Spectrometry (MS) in HK2 cells treated with cisplatin. The positions of PARVB and TAK1 were indicated. (D) HK2 cell lysates were immunoprecipitated with anti-PARVB antibody or mouse control IgG (mIgG) followed by immunoblotting with antibodies as indicated. (E) HK2 cell lysates were immunoprecipitated with anti-TAK1 antibody or rabbit control IgG (rIgG) followed by immunoblotting with antibodies as indicated. (F) Immunoblotting analysis of the expression level of TAK1 in control (Nc siRNA) and PARVB knockdown (PB siRNA1 and PB siRNA2) HK2 cells with or without cisplatin. Quantification analysis was shown in the right panel. **P < 0.01, ***P < 0.001 vs. HK2 + Cisplatin. n = 4 independent experiments. (G) Representative images of kidney sections stained with antibody against TAK1 in WT and PARVB cKO mice after cisplatin (15 mg/kg) or vehicle treatment. Scale bar: 50 μm. Quantification analysis was shown in the right panel. **P < 0.01 vs. WT + Cisplatin. n = 3 mice for each group. (H) Immunoblotting analysis of TAK1 protein level in control (Nc siRNA) or PARVB knockdown (PB siRNA1) HK2 cells treated with proteasomal inhibitor MG132 for 6 h and cisplatin for 48 h. MG132, 10 µM. Quantification analysis was shown in the lower panel. ***P < 0.001 vs. Nc siRNA + Vehicle. n = 3 independent experiments. (I) Control or PARVB knockdown HK2 cells were treated with MG132 for 6 h and cisplatin for 48 h, and then subjected to immunoprecipitated with anti-TAK1 antibody, followed by immunoblotting with antibodies as indicated. Ub: ubiquitin. (J) Immunoblotting analysis of the protein expression level of ERK, phosphorylated (p)-ERK, P38, phosphorylated (p)-P38 in control (Nc siRNA) and PARVB knockdown (PB siRNA1 and PB siRNA2) HK2 cells with or without cisplatin treatment. Quantification analysis of the ratio of p-ERK/ERK and p-P38/P38 was shown in the right panel. ***P < 0.001 vs. HK2 + Cisplatin. n = 3 independent experiments. CP, cisplatin
Fig. 6
Fig. 6
PARVB blocks ITCH-dependent TAK1 degradation. ITCH protein level was silenced by siRNA in Control (Nc siRNA) or PARVB knockdown (PB siRNA1) HK2 cells. (A) Immunoblotting analysis of the protein expression level of ITCH or TAK1 in cells as specified in the figure with cisplatin treatment (15 µM). Quantification analysis was shown in the right panel. ***P < 0.001 vs. Nc siRNA + Cisplatin, n = 4 independent experiments. (B) Cell lysates were immunoprecipitated with anti-TAK1 antibody followed by immunoblotting with antibodies as indicated. (C) Representative images of in situ PLA analyses of the TAK1-ITCH interaction (red dots) in cells as specified in the figure were shown in the upper panel. Cell nuclei were visualized with DAPI (blue). Scale bar: 10 μm. Quantification of PLA puncta per cell/field was shown in the lower panel. ***P < 0.001 vs. Nc siRNA + Cisplatin, n = 6 independent experiments. (D) Immunoblotting analysis of the protein expression level of ERK, phosphorylated (p)-ERK and P38, phosphorylated (p)-P38 in cells as specified in the figure with cisplatin treatment (15 µM). Quantification analysis was shown in the right panel. **P < 0.01, ***P < 0.001 vs. Nc siRNA + Cisplatin, n = 3 independent experiments. (E) Flow cytometry analysis of the apoptotic cells in cells as specified in the figure with cisplatin treatment (15 µM). Quantification analysis was shown in the right panel. ***P < 0.001 vs. Nc siRNA + Cisplatin, n = 3 independent experiments. (F) Immunoblotting analysis of the expression level of RIPK3, phosphorylated (p)-RIPK3 and cleaved-caspase-3 in cells as specified in the figure with cisplatin treatment. Quantification analysis was shown in the right panel. ***P < 0.001 vs. Nc siRNA + Cisplatin. n = 3 independent experiments. (G) qPCR analysis of TNF-ɑ and IL-1β mRNA expression in cells as specified in the figure with or without cisplatin (15 µM) treatment. ***P < 0.001 vs. Nc siRNA + Cisplatin, n = 3 independent experiments. CP, Cisplatin
Fig. 7
Fig. 7
Overexpression of TAK1 in PARVB-deficient cells aggravates cisplatin-induced tubular injury. Control (Nc siRNA) or PARVB knockdown (PB siRNA1) HK2 cells were infected with lentiviral vectors encoding full-length PARVB, TAK1 or empty vector. (A) Immunoblotting analysis of the protein expression level of ERK, phosphorylated (p)-ERK and p38, phosphorylated (p)-p38, TAK1 or PARVB in cells as specified in the figure with cisplatin (15 µM) treatment. Quantification analysis was shown in the right panel. ***P < 0.001 vs. Nc siRNA + Cisplatin, n = 3 independent experiments. CP, Cisplatin. (B) Flow cytometry analysis of the apoptotic cells in cells as specified in the figure with cisplatin treatment (15 µM). Quantification analysis was shown in the right panel. **P < 0.01 vs. Nc siRNA + Cisplatin, n = 3 independent experiments. (C) Immunoblotting analysis of the expression level of RIPK3, phosphorylated (p)-RIPK3 and cleaved-caspase-3 in cells as specified in the figure with cisplatin treatment. Quantification analysis was shown in the right panel. ***P < 0.001 vs. Nc siRNA + Cisplatin. n = 3 independent experiments. (D) qPCR analysis of TNF-ɑ and IL-1β mRNA expression in cells as specified in the figure with cisplatin treatment. **P < 0.01, ***P < 0.001 vs. Nc siRNA + Cisplatin, n = 3 independent experiments. (E) Schematic illustration of the mechanism of PARVB regulation of cisplatin-induced acute renal injury

Similar articles

References

    1. Ghosh S, Cisplatin (2019) The first metal based anticancer drug. Bioorg Chem 88:102925 10.1016/j.bioorg.2019.102925 - DOI - PubMed
    1. Yao X, Panichpisal K, Kurtzman N, Nugent K (2007) Cisplatin nephrotoxicity: a review. Am J Med Sci 334:115–124 10.1097/MAJ.0b013e31812dfe1e - DOI - PubMed
    1. Dasari S, Tchounwou PB (2014) Cisplatin in cancer therapy: molecular mechanisms of action. Eur J Pharmacol 740:364–378 10.1016/j.ejphar.2014.07.025 - DOI - PMC - PubMed
    1. Khairoun M, Uffen JW, Ocak G, Koopsen R, Haitjema S, Oosterheert JJ et al (2021) The incidence, mortality and renal outcomes of acute kidney injury in patients with suspected infection at the emergency department. PLoS ONE 16:e0260942 10.1371/journal.pone.0260942 - DOI - PMC - PubMed
    1. Dolman ME, Harmsen S, Storm G, Hennink WE, Kok RJ (2010) Drug targeting to the kidney: advances in the active targeting of therapeutics to proximal tubular cells. Adv Drug Deliv Rev 62:1344–1357 10.1016/j.addr.2010.07.011 - DOI - PubMed

MeSH terms

LinkOut - more resources