Gut microbial subtypes and clinicopathological value for colorectal cancer
- PMID: 39234654
- PMCID: PMC11375334
- DOI: 10.1002/cam4.70180
Gut microbial subtypes and clinicopathological value for colorectal cancer
Abstract
Background: Gut bacteria are related to colorectal cancer (CRC) and its clinicopathologic characteristics.
Objective: To develop gut bacterial subtypes and explore potential microbial targets for CRC.
Methods: Stool samples from 914 volunteers (376 CRCs, 363 advanced adenomas, and 175 normal controls) were included for 16S rRNA sequencing. Unsupervised learning was used to generate gut microbial subtypes. Gut bacterial community composition and clustering effects were plotted. Differences of gut bacterial abundance were analyzed. Then, the association of CRC-associated bacteria with subtypes and the association of gut bacteria with clinical information were assessed. The CatBoost models based on gut differential bacteria were constructed to identify the diseases including CRC and advanced adenoma (AA).
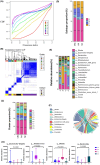
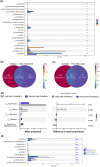
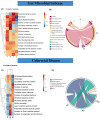
Results: Four gut microbial subtypes (A, B, C, D) were finally obtained via unsupervised learning. The characteristic bacteria of each subtype were Escherichia-Shigella in subtype A, Streptococcus in subtype B, Blautia in subtype C, and Bacteroides in subtype D. Clinical information (e.g., free fatty acids and total cholesterol) and CRC pathological information (e.g., tumor depth) varied among gut microbial subtypes. Bacilli, Lactobacillales, etc., were positively correlated with subtype B. Positive correlation of Blautia, Lachnospiraceae, etc., with subtype C and negative correlation of Coriobacteriia, Coriobacteriales, etc., with subtype D were found. Finally, the predictive ability of CatBoost models for CRC identification was improved based on gut microbial subtypes.
Conclusion: Gut microbial subtypes provide characteristic gut bacteria and are expected to contribute to the diagnosis of CRC.
Keywords: clinicopathological features; colorectal cancer; gut bacteria; gut microbial subtypes; unsupervised clustering.
© 2024 The Author(s). Cancer Medicine published by John Wiley & Sons Ltd.
Conflict of interest statement
The authors declare that no potential conflicts of interest exist.
Figures


Similar articles
-
Distinct gut microbiomes in Thai patients with colorectal polyps.World J Gastroenterol. 2024 Jul 21;30(27):3336-3355. doi: 10.3748/wjg.v30.i27.3336. World J Gastroenterol. 2024. PMID: 39086748 Free PMC article.
-
Gut microbes on the risk of advanced adenomas.BMC Microbiol. 2024 Jul 18;24(1):264. doi: 10.1186/s12866-024-03416-z. BMC Microbiol. 2024. PMID: 39026166 Free PMC article.
-
Gut microbiota alterations in colorectal adenoma-carcinoma sequence based on 16S rRNA gene sequencing: A systematic review and meta-analysis.Microb Pathog. 2024 Oct;195:106889. doi: 10.1016/j.micpath.2024.106889. Epub 2024 Aug 26. Microb Pathog. 2024. PMID: 39197689
-
Gut microbiome and colorectal adenomas.Cancer J. 2014 May-Jun;20(3):225-31. doi: 10.1097/PPO.0000000000000050. Cancer J. 2014. PMID: 24855012 Free PMC article. Review.
-
Escherichia coli on colorectal cancer: A two-edged sword.Microb Biotechnol. 2024 Oct;17(10):e70029. doi: 10.1111/1751-7915.70029. Microb Biotechnol. 2024. PMID: 39400440 Free PMC article. Review.
References
-
- Siegel RL, Wagle NS, Cercek A, Smith RA, Jemal A. Colorectal cancer statistics, 2023. CA Cancer J Clin. 2023;73(3):233‐254. - PubMed
-
- Morgan E, Arnold M, Gini A, et al. Global burden of colorectal cancer in 2020 and 2040: incidence and mortality estimates from GLOBOCAN. Gut. 2023;72(2):338‐344. - PubMed
-
- Cervantes A, Adam R, Roselló S, et al. Metastatic colorectal cancer: ESMO Clinical Practice Guideline for diagnosis, treatment and follow‐up. Ann Oncol. 2023;34(1):10‐32. - PubMed
MeSH terms
Substances
Grants and funding
LinkOut - more resources
Full Text Sources
Medical

