

Exploring cell-derived extracellular vesicles in peripheral blood and bone marrow of B-cell acute lymphoblastic leukemia pediatric patients: proof-of-concept study
- PMID: 39234258
- PMCID: PMC11371606
- DOI: 10.3389/fimmu.2024.1421036
Exploring cell-derived extracellular vesicles in peripheral blood and bone marrow of B-cell acute lymphoblastic leukemia pediatric patients: proof-of-concept study
Abstract
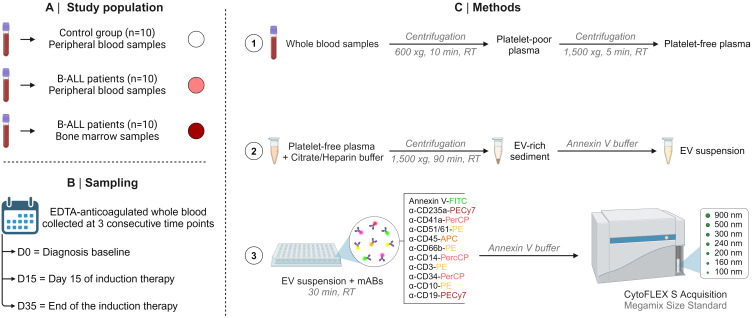
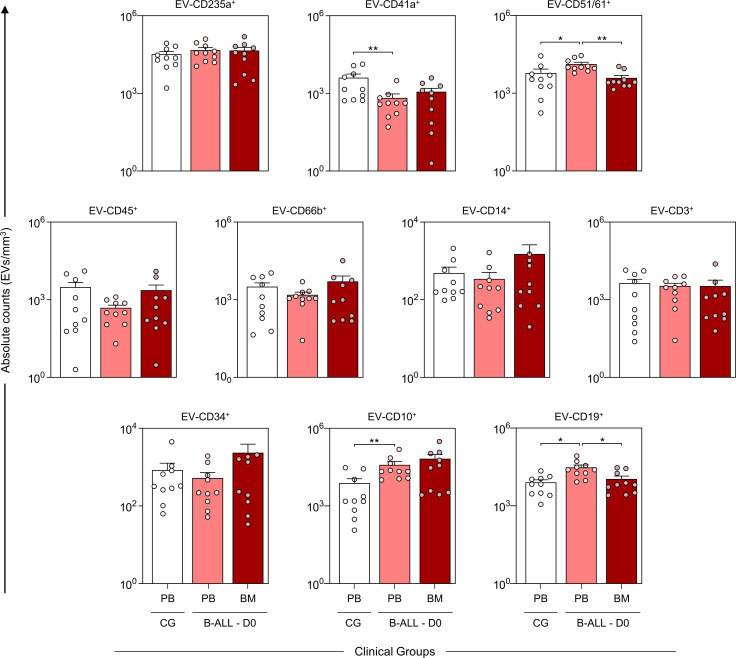
Extracellular vesicles (EVs) are heterogeneous, phospholipid membrane enclosed particles that are secreted by healthy and cancerous cells. EVs are present in diverse biological fluids and have been associated with the severity of diseases, which indicates their potential as biomarkers for diagnosis, prognosis and as therapeutic targets. This study investigated the phenotypic characteristics of EVs derived from peripheral blood (PB) and bone marrow (BM) in pediatric patients with B-cell acute lymphoblastic leukemia (B-ALL) during different treatment stages. PB and BM plasma were collected from 20 B-ALL patients at three time points during induction therapy, referred to as: diagnosis baseline (D0), day 15 of induction therapy (D15) and the end of the induction therapy (D35). In addition, PB samples were collected from 10 healthy children at a single time point. The EVs were measured using CytoFLEX S flow cytometer. Calibration beads were employed to ensure accurate size analysis. The following, fluorescent-labeled specific cellular markers were used to label the EVs: Annexin V (phosphatidylserine), CD235a (erythrocyte), CD41a (platelet), CD51 (endothelial cell), CD45 (leukocyte), CD66b (neutrophil), CD14 (monocyte), CD3 (T lymphocyte), CD19, CD34 and CD10 (B lymphoblast/leukemic blast). Our results demonstrate that B-ALL patients had a marked production of EV-CD51/61+, EV-CD10+, EV-CD19+ and EV-CD10+CD19+ (double-positive) with a decrease in EV-CD41a+ on D0. However, the kinetics and signature of production during induction therapy revealed a clear decline in EV-CD10+ and EV-CD19+, with an increase of EV-CD41a+ on D35. Furthermore, B-ALL patients showed a complex biological network, exhibiting distinct profiles on D0 and D35. Interestingly, fold change and ROC curve analysis demonstrated that EV-CD10+CD19+ were associated with B-ALL patients, exhibited excellent clinical performance and standing out as a potential diagnostic biomarker. In conclusion, our data indicate that EVs represent a promising field of investigation in B-ALL, offering the possibility of identifying potential biomarkers and therapeutic targets.
Keywords: biomarkers; childhood leukemia; extracellular vesicles; leukemic microenvironment; nano-flow cytometry.
Copyright © 2024 Magalhães-Gama, Malheiros Araújo Silvestrini, Neves, Araújo, Alves-Hanna, Kerr, Carvalho, Tarragô, Soares Pontes, Martins-Filho, Malheiro, Teixeira-Carvalho and Costa.
Conflict of interest statement
The authors declare that the research was conducted in the absence of any commercial or financial relationships that could be construed as a potential conflict of interest.
Figures
 ) and B-ALL BM (
 ) groups and in the control group (CG) (
 ). The count and immunophenotypic characterization of EVs was performed using flow cytometry, as described in the Materials and Methods section. The results are presented using bar and symbol charts, reported in log10 scale, showing the mean with standard error of the absolute number of EVs/mm3 of plasma. Statistical analyses were performed using Student’s t test or the Mann-Whitney test and significant differences are highlighted by asterisks for p<0.01 (**) or p<0.05 (*).
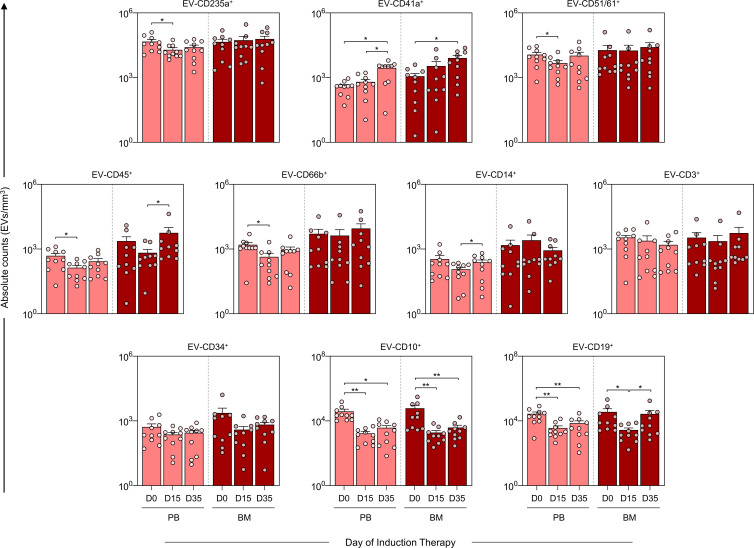 ) and B-ALL BM () groups to assess the behavior of these EVs during remission induction therapy. The count and immunophenotypic characterization of the EVs was performed using flow cytometry, as described in the Materials and Methods section. The results are presented using bar and symbol charts, reported in log10 scale, showing the mean with standard error of the absolute number of EVs/mm3 of plasma. Statistical analyses were performed using a paired t test or Wilcoxon matched-pairs signed-rank test for comparisons between D0, D15 and D35 and significant differences are highlighted by asterisks for p<0.01 (**) or p<0.05 (*).
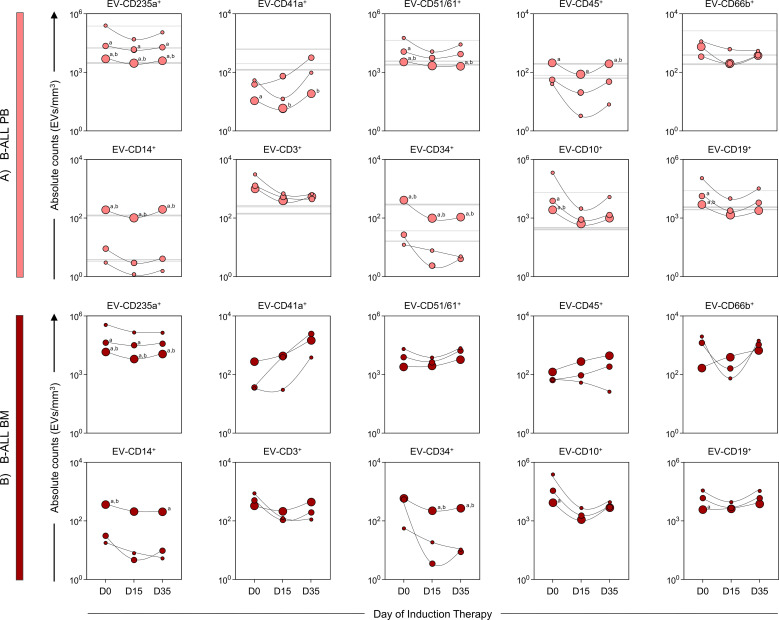
 ) and (B) B-ALL BM (
 ) groups according to their size, based on Megamix beads size range, being divided into small EVs = 100-200 nm (sEVs), medium EVs = 201-500 nm (mEVs) and large EVs = 501-900 nm (lEVs), represented by the symbols: “
 ”, “” and “
 ”, respectively. For the control group, sEVs, mEVs, and lEVs were represented by gray background lines: “
 ”, “
”, “ ” and “
 ”, respectively. The count, size and immunophenotypic characterization of the EVs was performed using flow cytometry, as described in the Materials and Methods section. The results are presented using symbol charts, reported in log10 scale, showing the median of the absolute number of EVs/mm3 of plasma. Statistical analyses were performed using a paired t test or Wilcoxon matched-pairs signed-rank test for comparisons between sEVs, mEVs, and lEVs and significant differences are represented by the letters: “a” and “b”, which refer to the comparisons with sEVs and mEVs, respectively.
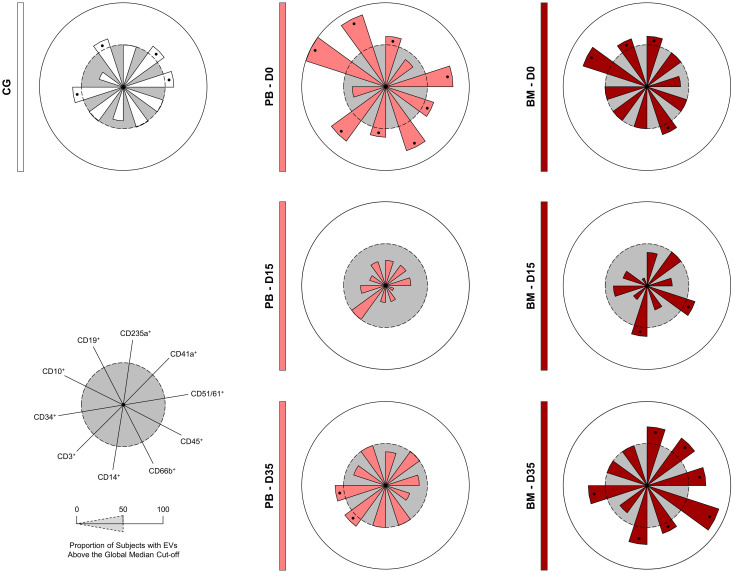
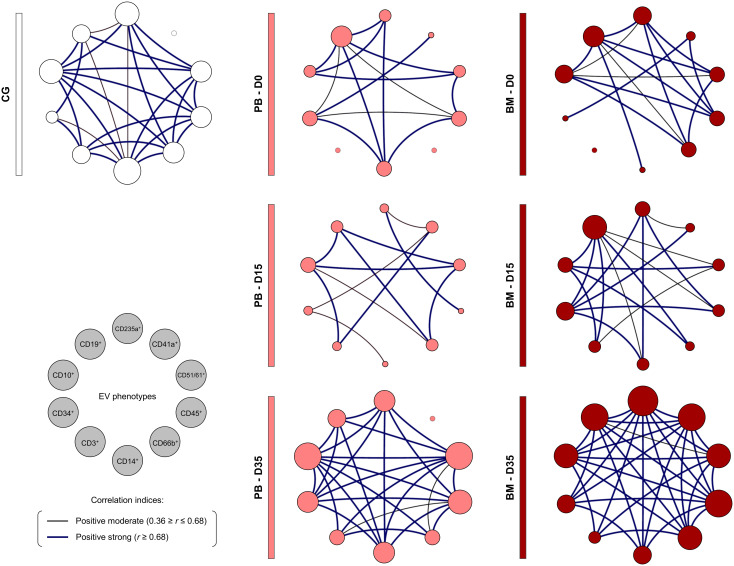 ) and B-ALL BM () groups and in the control group (CG) (
 ), where the larger the node, the greater the number of interactions established. Correlation analysis was employed to construct integrative networks according to significant “r” scores at p<0.05 using the Spearman correlation test. Connecting edges illustrate the positive correlations between pairs of attributes, according to the strength of correlation as described in the Materials and Methods section. Different colored and thickness are used to represent moderate correlations (black fine edges) and strong correlations (dark blue solid edges). Cellular markers: CD235a (erythrocyte), CD41a (platelet), CD51 (endothelial cell), CD45 (leukocyte), CD66b (neutrophil), CD14 (monocyte), CD3 (T lymphocyte), CD34 and CD10 (B lymphoblast/Leukemic blast) and CD19 (B lymphocyte/B lymphoblast).
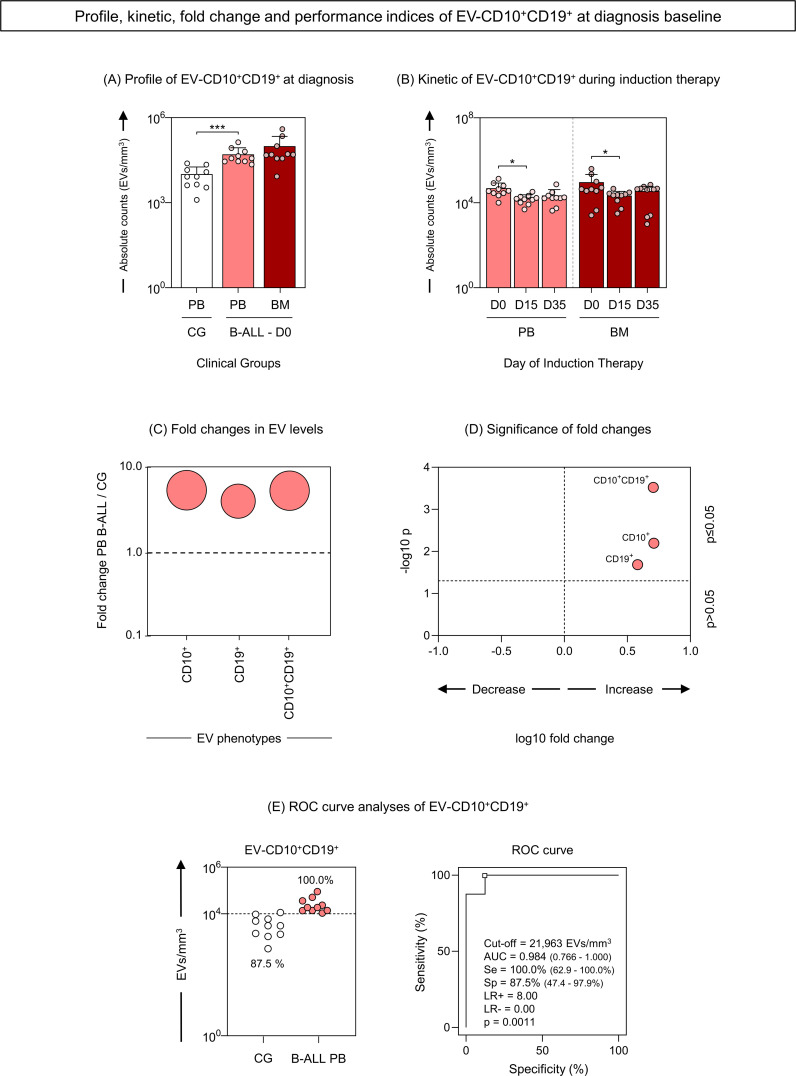 ) and B-ALL BM () groups and in the control group (CG) (). The count and immunophenotypic characterization of EV-CD10+CD19+ was performed using flow cytometry. The results are presented using bar and symbol charts, reported in log10 scale, showing the mean with standard error of the absolute number of EVs/mm3 of plasma. Statistical analyses were performed using the Mann-Whitney test or Wilcoxon matched-pairs signed-rank test and significant differences are highlighted by asterisks for p<0.001 (***) or p<0.05 (*). The fold changes (C) and significance of fold changes (D) were performed in the peripheral blood of the B-ALL patients at the diagnosis baseline. Receiver operating characteristic (ROC) curve analysis (E) was carried out to assess the performance of EV-CD10+CD19+ plasma levels as diagnostic biomarkers for B-ALL. ROC curves were assembled to define the cut-off points and calculate the following performance indices: sensitivity (Se), specificity (Sp), likelihood ratio (LR), the best cut-off point, as well as the area under the curve (AUC) and p-value as indicators of global accuracy.
Similar articles
-
Immunophenotypic shift in the B-cell precursors from regenerating bone marrow samples: A critical consideration for measurable residual disease assessment in B-lymphoblastic leukemia.Cytometry B Clin Cytom. 2021 Jul;100(4):434-445. doi: 10.1002/cyto.b.21951. Epub 2020 Sep 8. Cytometry B Clin Cytom. 2021. PMID: 32896101
-
[Flow cytometric detection of minimal residual disease in pre-cursor-B-acute lymphoblastic leukemia on the basis of phenotypic aberrancies on minor leukemic cell populations].Zhongguo Shi Yan Xue Ye Xue Za Zhi. 2005 Aug;13(4):557-62. Zhongguo Shi Yan Xue Ye Xue Za Zhi. 2005. PMID: 16129033 Chinese.
-
Immunophenotypic Modulation of the Blast Cells in Childhood Acute Lymphoblastic Leukemia Minimal Residual Disease Detection.Folia Med (Plovdiv). 2016 Mar 1;58(1):28-35. doi: 10.1515/folmed-2016-0004. Folia Med (Plovdiv). 2016. PMID: 27383875
-
Lymphoblastic lymphoma.Crit Rev Oncol Hematol. 2011 Sep;79(3):330-43. doi: 10.1016/j.critrevonc.2010.12.003. Epub 2011 Jan 26. Crit Rev Oncol Hematol. 2011. PMID: 21273093 Review.
-
Circulating extracellular vesicles as biomarkers in the diagnosis, prognosis and therapy of cardiovascular diseases.Front Cardiovasc Med. 2024 Sep 2;11:1425159. doi: 10.3389/fcvm.2024.1425159. eCollection 2024. Front Cardiovasc Med. 2024. PMID: 39314768 Free PMC article. Review.
References
-
- Chiarini F, Lonetti A, Evangelisti C, Buontempo F, Orsini E, Evangelisti C, et al. . Advances in understanding the acute lymphoblastic leukemia bone marrow microenvironment: From biology to therapeutic targeting. Biochim Biophys Acta - Mol Cell Res. (2016) 1863:449–63. doi: 10.1016/j.bbamcr.2015.08.015 - DOI - PubMed
MeSH terms
Substances
Grants and funding
LinkOut - more resources
Full Text Sources
Research Materials
Miscellaneous