Case Reports
. 2024 Sep 10;121(37):e2321794121.
doi: 10.1073/pnas.2321794121. Epub 2024 Sep 4.

Inherited human RelB deficiency impairs innate and adaptive immunity to infection

Affiliations
Case Reports

Inherited human RelB deficiency impairs innate and adaptive immunity to infection

Tom Le Voyer et al. Proc Natl Acad Sci U S A. .

Abstract

We report two unrelated adults with homozygous (P1) or compound heterozygous (P2) private loss-of-function variants of V-Rel Reticuloendotheliosis Viral Oncogene Homolog B (RELB). The resulting deficiency of functional RelB impairs the induction of NFKB2 mRNA and NF-κB2 (p100/p52) protein by lymphotoxin in the fibroblasts of the patients. These defects are rescued by transduction with wild-type RELB complementary DNA (cDNA). By contrast, the response of RelB-deficient fibroblasts to Tumor Necrosis Factor (TNF) or IL-1β via the canonical NF-κB pathway remains intact. P1 and P2 have low proportions of naïve CD4+ and CD8+ T cells and of memory B cells. Moreover, their naïve B cells cannot differentiate into immunoglobulin G (IgG)- or immunoglobulin A (IgA)-secreting cells in response to CD40L/IL-21, and the development of IL-17A/F-producing T cells is strongly impaired in vitro. Finally, the patients produce neutralizing autoantibodies against type I interferons (IFNs), even after hematopoietic stem cell transplantation, attesting to a persistent dysfunction of thymic epithelial cells in T cell selection and central tolerance to some autoantigens. Thus, inherited human RelB deficiency disrupts the alternative NF-κB pathway, underlying a T- and B cell immunodeficiency, which, together with neutralizing autoantibodies against type I IFNs, confers a predisposition to viral, bacterial, and fungal infections.

Keywords: NF-κB pathway; RelB deficiency; autoantibodies; immunodeficiency; type I IFNs.


Conflict of interest statement

Competing interests statement:Tim Niehues was a co-author on publications with the following co-authors within the last 4 y: K.B., C.S.M., and S.G.T. (https://doi.org/10.1182/blood.2020006738) and K.B. (https://doi.org/10.1016/j.jaci.2019.11.051; https://doi.org/10.1002/eji.202048713). Andrew R. Gennery was a co-author with S.G.T. (https://doi.org/10.1016/j.jaci.2020.09.010; https://doi.org/10.1016/j.jaci.2022.09.002) within the last 4 y.

Figures

Fig. 1.
Fig. 1.
AR RelB deficiency in two unrelated patients. (A) Pedigrees of the two unrelated families. The familial segregation of the variants identified in P1 and P2 is depicted. The double lines connecting P1’s parents indicate consanguinity. An arrow indicates the probands. Solid symbols indicate disease status. “E?” indicates individuals of unknown genotype. (B) The CADD score and MAF of the variants of P1 and P2 (shown in red), the two previously reported disease-causing variants (shown in blue) (7, 23, 24), and the two homozygous missense variants found in the gnomAD 2.1 database (shown in black). All variants from P1, P2, and the four previously reported patients are private. The variants are plotted according to their CADD scores (y-axis) and MAF (x-axis). The black horizontal dotted line indicates the MSC. (C) Schematic diagram of the RelB protein. The regions corresponding to functionally significant domains are shown in dark gray (LZ: leucine zipper domain; RHD: Rel homology domain; TAD: transactivation domain). The variants of P1 and P2 are shown in red; the two previously reported disease-causing variants are indicated in blue, and the variants reported in the homozygous state in gnomAD appear in black. (D) Immunoblot analysis of RelB expression on total protein extracts from non-transfected HEK 293 T (NT) cells, or HEK 293 T cells transfected with an empty pCMV6 plasmid (EV), or pCMV6 plasmids containing the WT, P1’s variant (c.C212dup, p.Q72Tfs*152, or p.Q72fs), P2’s variant (c.433G>A/c.1091C>T, p.E145K/p.P364L), the previously reported disease-causing variants (c.1191C>A, p.Y397*, and c.400_c.401insAGC/p.Q135dup), or the two missense (c.1249G>A, p.D417N, and c.1459G>T, p.D487Y) variants of RELB present in the homozygous state in gnomAD. RelB was detected with a mAb specific for the C- or N-terminal region or with an antibody against the DDK tag. Actin was used as a loading control. The results shown are representative of three independent experiments. (E) Luciferase activity of HEK 293 T cells after 48 h of transfection with an NF-κB reporter plasmid together with an empty pCMV6 vector (EV), or a pCMV6 vector encoding wild-type (WT), P1’s variant (c.C212dup/p.Q72Tfs*152), P2’s variant (c.433G>A/p.E145K and c.1091C>T/p.P364L), the previously reported disease-causing (c.1191 C>A/p.Y397* and c.400_c.401insAGC/p.Q135dup) variants, and the two missense (c.1249 G > A/p.D417N; c.1459 G>T/p.D487Y) RelB variants present in the homozygous state in gnomAD, with or without the pCMV6-NFKB2-DDK plasmid encoding p100. Results were normalized against Renilla luciferase activity. Results were then normalized against the level of transcriptional activity for the WT p52/RelB dimer. The mean ± SD of one representative experiment (performed with a biological duplicate) is shown.
Fig. 2.
Fig. 2.
Impaired RELB expression and impaired activation of the alternative NF-κB pathway in the fibroblasts of P1 and P2. (A) RNAs extracted from SV40-immortalized fibroblasts (SV40-F) from healthy controls (C), P1, and P2 were subjected to RT-qPCR for total RELB. Data are expressed as 2-ΔCt relative to the mean expression of controls, after normalization against GUS (endogenous control) expression (ΔCt). (B and C) RNA extracted from primary fibroblasts from three different healthy subjects (C), P1, P2, and a patient with AR complete NIK deficiency stimulated with lymphotoxin α1β2 (Lt) for 24 h and subjected to RT-qPCR for NFKB2 (B) or VCAM1 (C). (D) Immunoblot analysis of phosphorylated p100 (P-p100), NF-κB2 (p100/p52), RelB, NF-κB1 (p105/p50), and RelA levels in primary fibroblasts from healthy controls (C1 and C2), P1, P2, and a NIK-deficient patient (NIK−/−) (8). Actin immunoblotting was used as a loading control. The results shown are representative of two independent experiments. (E) Graph showing the p100/p52 ratio in primary fibroblasts from healthy controls (C1 and C2), P1, P2, and a NIK-deficient patient (NIK−/−), based on data from two independent experiments. (F) Primary fibroblasts from controls (C1 and C2), the two RelB-deficient patients (P1 and P2, in red), a patient with a p52LOF/IκBδGOF variant (6) and a NIK-deficient patient (NIK−/−) (8), were left unstimulated or were stimulated with TWEAK for 48 h and stained with a rabbit anti-C-terminal RelB or a mouse anti-N-terminal p100 mAb. Nuclei were stained with DAPI.
Fig. 3.
Fig. 3.
Rescue of defective non-canonical NF-κB signaling in P1 fibroblasts. (A) SV40-F from a healthy control (C) and P1 were stably transduced with an empty vector (EV) or the WT RELB cDNA. SV40-F from the healthy control and P1 were also transduced with the Q72Tfs, E145K, P364L, or Y397* mutant RELB cDNA. The RNA extracted from these cells was subjected to RT-qPCR for total RELB. Data are displayed as 2−ΔCt relative to EV-transduced cells, after normalization against GUSB (endogenous control) expression (ΔCt). The result of one representative experiment is shown. (B) SV40-F from a healthy control (Left) or from P1 (Right) were stably transduced with an EV, the WT or a mutant (Q72fs, E145K, P364L, or Y397*) RELB cDNA. The cells were either left unstimulated (NS, gray bars for the control or red bars for P1) or were stimulated for 24 h with Lt (black bars). The RNA extracted from these cells was subjected to RT-qPCR for total NFKB2. Data are displayed as 2−ΔCt values relative to unstimulated EV-transduced cells, after normalization against GUSB (endogenous control) expression (ΔCt). The result of one independent experiment is shown.
Fig. 4.
Fig. 4.
Normal activation of the canonical NF-κB pathway in fibroblasts from P1 and P2. (A) Immunoblot analysis of the cytoplasmic and nuclear fractions of SV40-F from healthy controls (C1 and C2), P1, P2, or SV40-F deficient for NEMO (NEMOY/−) left unstimulated or stimulated with TNF for 4 h, and assessed for the levels of NF-κB1 (p105/p50), RelA (p65), RelB, and NF-κB2 (p100). The (*) symbol indicates non-specific bands. Tubulin and β-actin were used as loading controls. (B) SV40-F from controls (C1 and C2), the two RelB-deficient patients (P1 and P2, in red), and NEMO-deficient SV40-F (NEMOY/−) were stimulated with TNF for 4 h, and stained with a mouse anti-C-terminal RelA or a mouse anti-N-terminal p105 antibody. Nuclei were labeled with DAPI.
Fig. 5.
Fig. 5.
Auto-Abs against type I IFNs in P1 and P2. (A) Auto-Abs neutralizing IFN-α2, IFN-ω, or IFN-β at concentrations of 10 ng/mL or 100 pg/mL were assessed in an ISRE luciferase assay. The gray area corresponds to the normal ISRE activity obtained with non-neutralizing plasma from healthy controls. (B) Protein microarray showing the distribution of auto-Ab reactivity against 20,000 human proteins in plasma samples from patients with AR RelB deficiency (n = 2, P1 and P2, aged 19 and 32 y, respectively). Data are expressed as the fold-change relative to 22 plasma samples from healthy donors. Red dots represent type I IFNs and yellow dots represent type III IFNs. Data for HuProt and neutralization assay experiments are presented as the mean for at least two technical replicates. (C) Venn diagram showing the enriched autoantigen profile (log2-fold change relative to healthy controls >1.5) of patients with APS-1 (n = 14), p52LOF/IκBδGOF variants (n = 12), or AR RelB deficiency (n = 2). Type I IFNs are indicated in bold. (D) Proportion of shared (by ≥2 patients) and private reactive autoantigens in the group of patients with APS-1, a p52LOF/IκBδGOF variant, or AR RelB deficiency. (E) Reactive autoantigens common to the two patients with AR RelB deficiency included in the analysis. Red dots indicate type I IFNs.
Fig. 6.
Fig. 6.
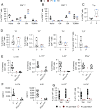
RelB deficiency compromises T cell development and functions. Immunophenotyping of PBMCs from 4-13 healthy controls (C, black dots), P1 (red dots), and P2 (blue dots). (AC) Frequency of naïve (CD45RA+CCR7+), central memory (CM, CD45RACCR7+), effector memory (EM, CD45RA+/−CCR7), and terminally differentiated effector memory (TEMRA, CDR45RACCR7) cells among the CD4+ (A) and CD8+ (B) T cells of healthy subjects (C, n = 4), P1 before HSCT, and P2. (C) Frequency of Treg (CD3+CD4+CD25hiFoxP3+) cells in the CD4+ T cell compartment in controls (n = 4), P1 before HSCT, and P2. (D) Frequencies of Th subsets among memory CD4+ T cells from controls (n = 5), P1 before HSCT, and P2. Subsets were defined as follows: Th1 (CXCR5CXCR3+CCR4CCR6), Th1* (CXCR5CXCR3+CCR4CCR6+), Th2 (CXCR5CXCR3CCR4+CCR6), and Th17 (CXCR5CXCR3CCR4+CCR6+). Dotted horizontal lines represent the median value in each distribution. (E) Percentages of cells expressing IL-17A, IL-17F, IL-22, and IFN-γ ex vivo, as determined by flow cytometry, among memory CD4+ T cells from PBMCs activated by incubation with PMA and ionomycin for 8 h. (F) IL-17A and IL-22 production assessed by specific ELISA on whole-blood supernatants stimulated by incubation for 24 h with PMA and ionomycin. The two experiments were conducted in parallel for healthy subjects (n = 10), the RelB-deficient patient (P1), and patients with heterozygous gain-of-function STAT1 mutations (n = 6). (G) Cytokine production, measured by ELISA, for IL-17A and IL-17F after 4 d of culture in Th0 or Th17 conditions, for cells from nine different healthy donors, and from P1 before (pre-) and after (post-) HSCT.
Fig. 7.
Fig. 7.
RelB deficiency impairs peripheral B cell development and function in P1. (A and B) Immunophenotyping of PBMCs from healthy donors (C, n = 10, filled black circles), and P1 before (pre, filled red circles) and after (post, red circles) HSCT. Subsets were defined by labeling with mAbs against CD20, CD10, CD27, IgG, IgA, and IgM. The proportions of B (CD20+) cells within the lymphocyte gate (A), and of transitional (IgM+IgD+/−CD10+CD27), naïve (IgM+IgD+CD27), and memory (CD27+) cells within the B cell compartment (B) are shown. (C) Proportions of IgM+, IgG+, and IgA+ cells within the memory B cell population, as determined by flow cytometry. (DF). Naïve B cells from six healthy subjects, and P1 before (pre) and after (post) HSCT were sorted and incubated with CD40L alone or together with CpG, BCR ligand, or IL-21 for 7 d. The secretion of IgM (D), IgG (E), and IgA (F) into the supernatant was assessed by Ig heavy chain–specific ELISA. The limit of detection corresponds to 1.

Similar articles

References

    1. Hayden M. S., Ghosh S., NF-κB in immunobiology. Cell Res. 21, 223–244 (2011). - PMC - PubMed
    1. Sun S. C., The non-canonical NF-κB pathway in immunity and inflammation. Nat. Rev. Immunol. 17, 545–558 (2017). - PMC - PubMed
    1. Shih V. F.-S., Tsui R., Caldwell A., Hoffmann A., A single NFκB system for both canonical and non-canonical signaling. Cell Res. 21, 86–102 (2011). - PMC - PubMed
    1. Fusco A. J., et al. , The NF-κB subunit RelB controls p100 processing by competing with the kinases NIK and IKK1 for binding to p100. Sci. Signal. 9, ra96 (2016). - PubMed
    1. Millet P., McCall C., Yoza B., RelB: An outlier in leukocyte biology. J. Leukoc. Biol. 94, 941–951 (2013). - PMC - PubMed

Publication types

Grants and funding

LinkOut - more resources