This is a preprint.
Tracking clonal evolution of drug resistance in ovarian cancer patients by exploiting structural variants in cfDNA
- PMID: 39229105
- PMCID: PMC11370573
- DOI: 10.1101/2024.08.21.609031
Tracking clonal evolution of drug resistance in ovarian cancer patients by exploiting structural variants in cfDNA
Abstract
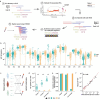
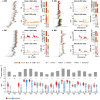
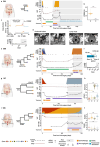
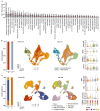
Drug resistance is the major cause of therapeutic failure in high-grade serous ovarian cancer (HGSOC). Yet, the mechanisms by which tumors evolve to drug resistant states remains largely unknown. To address this, we aimed to exploit clone-specific genomic structural variations by combining scaled single-cell whole genome sequencing with longitudinally collected cell-free DNA (cfDNA), enabling clonal tracking before, during and after treatment. We developed a cfDNA hybrid capture, deep sequencing approach based on leveraging clone-specific structural variants as endogenous barcodes, with orders of magnitude lower error rates than single nucleotide variants in ctDNA (circulating tumor DNA) detection, demonstrated on 19 patients at baseline. We then applied this to monitor and model clonal evolution over several years in ten HGSOC patients treated with systemic therapy from diagnosis through recurrence. We found drug resistance to be polyclonal in most cases, but frequently dominated by a single high-fitness and expanding clone, reducing clonal diversity in the relapsed disease state in most patients. Drug-resistant clones frequently displayed notable genomic features, including high-level amplifications of oncogenes such as CCNE1, RAB25, NOTCH3, and ERBB2. Using a population genetics Wright-Fisher model, we found evolutionary trajectories of these features were consistent with drug-induced positive selection. In select cases, these alterations impacted selection of secondary lines of therapy with positive patient outcomes. For cases with matched single-cell RNA sequencing data, pre-existing and genomically encoded phenotypic states such as upregulation of EMT and VEGF were linked to drug resistance. Together, our findings indicate that drug resistant states in HGSOC pre-exist at diagnosis and lead to dramatic clonal expansions that alter clonal composition at the time of relapse. We suggest that combining tumor single cell sequencing with cfDNA enables clonal tracking in patients and harbors potential for evolution-informed adaptive treatment decisions.
Conflict of interest statement
B.W. reports grant funding by Repare Therapeutics paid to the institution, outside the submitted work, and employment of a direct family member at AstraZeneca. C.A. reports grants from Clovis, Genentech, AbbVie and AstraZeneca and personal fees from Tesaro, Eisai/Merck, Mersana Therapeutics, Roche/Genentech, Abbvie, AstraZeneca/Merck and Repare Therapeutics, outside the scope of the submitted work. C.A. reports clinical trial funding to the institution from Abbvie, AstraZeneca, and Genentech/Roche; participation on a data safety monitoring board or advisory board in AstraZeneca and Merck; unpaid membership of the GOG Foundation Board of Directors and the NRG Oncology Board of Directors. M.F.B reports consulting fees (Eli Lilly, AstraZeneca, Paige.AI), Research Support (Boundless Bio) and Intellectual Property Rights (SOPHiA Genetics). BL reports Intellectual propery rights (SOPHiA Genetics) and licensing royalties (BioLegend/Revvity). C.F. reports research funding to the institution from Merck, AstraZeneca, Genentech/Roche, Bristol Myers Squibb, and Daiichi; uncompensated membership of a scientific advisory board for Merck and Genentech; and is a consultant for OncLive, Aptitude Health, Bristol Myers Squibb and Seagen, all outside the scope of this manuscript. D.S.C. reports membership of the medical advisory board of Verthermia Acquio Inc and Biom’up, is a paid speaker for AstraZeneca, and holds stock of Doximity, Moderna, and BioNTech. D.Z. reports institutional grants from Merck, Genentech, AstraZeneca, Plexxikon, and Synthekine, and personal fees from AstraZeneca, Xencor, Memgen, Takeda, Astellas, Immunos, Tessa Therapeutics, Miltenyi, and Calidi Biotherapeutics. D.Z. own a patent on use of oncolytic Newcastle Disease Virus for cancer therapy. N.A.-R. reports grants to the institution from Stryker/Novadaq and GRAIL, outside the submitted work. S.P.S. reports research funding from AstraZeneca and Bristol Myers Squibb, outside the scope of this work.
Figures


Similar articles
-
Whole-Exome Sequencing of Cell-Free DNA Reveals Temporo-spatial Heterogeneity and Identifies Treatment-Resistant Clones in Neuroblastoma.Clin Cancer Res. 2018 Feb 15;24(4):939-949. doi: 10.1158/1078-0432.CCR-17-1586. Epub 2017 Nov 30. Clin Cancer Res. 2018. PMID: 29191970
-
The Landscape of Actionable Genomic Alterations in Cell-Free Circulating Tumor DNA from 21,807 Advanced Cancer Patients.Clin Cancer Res. 2018 Aug 1;24(15):3528-3538. doi: 10.1158/1078-0432.CCR-17-3837. Epub 2018 May 18. Clin Cancer Res. 2018. PMID: 29776953
-
Identifying Mechanisms of Resistance by Circulating Tumor DNA in EVOLVE, a Phase II Trial of Cediranib Plus Olaparib for Ovarian Cancer at Time of PARP Inhibitor Progression.Clin Cancer Res. 2023 Sep 15;29(18):3706-3716. doi: 10.1158/1078-0432.CCR-23-0797. Clin Cancer Res. 2023. PMID: 37327320 Free PMC article. Clinical Trial.
-
Studying platinum sensitivity and resistance in high-grade serous ovarian cancer: Different models for different questions.Drug Resist Updat. 2016 Jan;24:55-69. doi: 10.1016/j.drup.2015.11.005. Epub 2015 Nov 26. Drug Resist Updat. 2016. PMID: 26830315 Review.
-
Using circulating cell-free DNA to monitor personalized cancer therapy.Crit Rev Clin Lab Sci. 2017 May;54(3):205-218. doi: 10.1080/10408363.2017.1299683. Epub 2017 Apr 10. Crit Rev Clin Lab Sci. 2017. PMID: 28393575 Review.
References
Publication types
Grants and funding
LinkOut - more resources
Full Text Sources
Research Materials
Miscellaneous
