[Preprint]. 2024 Aug 19:2024.08.16.608328.
doi: 10.1101/2024.08.16.608328.

MiniXL: An open-source, large field-of-view epifluorescence miniature microscope for mice capable of single-cell resolution and multi-brain region imaging

Affiliations

MiniXL: An open-source, large field-of-view epifluorescence miniature microscope for mice capable of single-cell resolution and multi-brain region imaging

Pingping Zhao et al. bioRxiv. .

Abstract

Capturing the intricate dynamics of neural activity in freely behaving animals is essential for understanding the neural mechanisms underpinning specific behaviors. Miniaturized microscopy enables investigators to track population activity at cellular level, but the field of view (FOV) of these microscopes have been limited and does not allow multiple-brain region imaging. To fill this technological gap, we have developed the eXtra Large field-of-view Miniscope (MiniXL), a 3.5g lightweight miniaturized microscope with an FOV measuring 3.5 mm in diameter and an electrically adjustable working distance of 1.9 mm ± 200 μm. We demonstrated the capability of MiniXL recording the activity of large neuronal population in both subcortical area (hippocampal dorsal CA1) and deep brain regions (medial prefrontal cortex, mPFC and nucleus accumbens, NAc). The large FOV allows simultaneous imaging of multiple brain regions such as bilateral mPFCs or mPFC and NAc during complex social behavior and tracking cells across multiple sessions. As with all microscopes in the UCLA Miniscope ecosystem, the MiniXL is fully open-source and will be shared with the neuroscience community to lower the barriers for adoption of this technology.


Conflict of interest statement

Competing interests: The authors declare no competing interests.

Figures
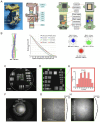
Fig. 1
Fig. 1. Optical design and performance of MiniXL.
(A) Left panel: photograph of MiniXL. Middle panel: Cross section profile. Right panel: PCB layout. Scale bar, 1 cm. (B) Zemax simulation of emission path shows a 1.9 mm working distance (WD) with 300-μm field curvature across a 3-mm diameter FOV in the object space (left). MTFs on the image plane (top right), and spot diagram of the optics (left panel), MTFs on the image plane (middle), and spot diagram of the optics (right). In the spot diagram, root mean square (RMS) radius is 1.480 μm at the center and 1.808/1.640 μm at (0, 1.5 mm/−1.5 mm). The magnification of the optics is given by 1.19 calculated from the spot diagram. (C-E) FOV (3.5 mm in diameter) shown using the Ø1” 1951 USAF Targe (#R1DS1N, Thorlabs). Scale bars, 1 mm (C) and 100 μm (D). The value 4.4 μm (group 7 element 6, 228 lps/mm) can be resolved from the green line in (D) (E). (F-H) Comparison of MiniXL (F, G) and Miniscope V4 (H) in the same ROI. The field of view of Miniscope V4 is 1.1 mm in diameter. MiniXL shows more uniform fluorescent detection than Miniscope V4.
Figure 2.
Figure 2.. Imaging the activity of dCA1 place cells on a linear track.
(A) Surgical implantation of GRIN lenses and baseplate. Two GRIN lens were stacked with the bottom one implanted upon dCA1 region. (B) Animals were trained to run on a 2-m linear track for water reward on two ends. (C) Example brain slice showing GCaMp6f expression and GRIN lens implantation track. (D, E) Example raw image of field of view and all cells identified across three days (N=1640). Each field of view is cropped to approximately 1.393 mm × 1.393 mm. (F-H) Identified place cells (green) on Day1 (N1=453), Day2 (N=548) and Day3 (N=561). There are 91 cells were identified as place cells and were matched across all sessions (red). (I) Ratio of place cells and the other cells on each day. (J) Overlap of place cells between every two days and among three days. (K-M) Normalized neural activity rates of place cells on Day 1 (K) that were also active on Day2 (L) and Day 3 (M). cells were sorted by the peak firing rate from Day 1. (N) Mean stability of place cells and other cells on each day of one example mouse. Place cells showed significant higher stability than other cells (unpaired Student’s t-test, P <0.0001).
Figure. 3
Figure. 3. Imaging place cells in the open field arena.
(A) Snapshot of mouse behavioral recording in open field arena. (B) The trajectory of mouse running in the arena. (C) Raw calcium fluorescence of the field of view from example animal. (D) Single neurons extracted from the field of view by CNMF-E with identified place cells indicated in red. (E) Example of four places cells with spatial information value and stability score. (F) Comparison of the stability score of place cells and other cells. (G) Environment coverage of place fields.
Figure. 4
Figure. 4. Bilateral imaging of PFC in freely behaving mice using MiniXL.
(A) Diagram of bilateral lens implantation above left and right mPFC and baseplate installation. (B) MiniXL’s FOV across dual GRIN relay lens implants above mPFC. (C) Schematic diagram of social interaction session counterbalanced with object exploration during calcium imaging with MiniXL. (D) Percentage of time that animal spent on social interaction and object exploration. (E, F) Raw calcium fluorescence frame from an example animal and single neurons extracted from the FOV. (G, H) Mean calcium traces of social excited cells (SE), social inhibited cells (SI), object excited cells (OE) and object inhibited cells (OI) recorded from example mouse’s left and right mPFC. (I, J) Percentage of SE, SI, OE, OI and social/object non-modulated cells. (K) Distribution of SE, SI, OE and OI in left and right mPFC. (L) Comparison of the correlation of left and right mPFC during social interaction session and object exploration session.
Fig 5.
Fig 5.. PFC-NAc simultaneous imaging by MiniXL.
(A, E) Diagram of lens implantation in PFC (0.5mm/6.1mm in A and 1mm/4mm in E) and Nac (0.5mm/8.4mm). A, NAc: GCaMP6f, PFC: GCaMP6f; E, NAc: retro-Cre+GCaMP6f, PFC: Flex-GCaMP6f. (B, F) Raw calcium fluorescence frame of the FOV from example animals and single neurons extracted from the FOV. (C, G) Trajectory of mouse in open field test. (D, H) Example of calcium traces recorded from NAc and mPFC.

Similar articles

References

    1. Chen T.-W., Wardill T. J., Sun Y., Pulver S. R., Renninger S. L., Baohan A., Schreiter E. R., Kerr R. A., Orger M. B., Jayaraman V., Looger L. L., Svoboda K., Kim D. S., Ultrasensitive fluorescent proteins for imaging neuronal activity. Nature 499, 295–300 (2013). - PMC - PubMed
    1. Ghosh K. K., Burns L. D., Cocker E. D., Nimmerjahn A., Ziv Y., El Gamal A., Schnitzer M. J., Miniaturized integration of a fluorescence microscope. Nat Methods 8, 871–878 (2011). - PMC - PubMed
    1. Ziv Y., Burns L. D., Cocker E. D., Hamel E. O., Ghosh K. K., Kitch L. J., El Gamal A., Schnitzer M. J., Long-term dynamics of CA1 hippocampal place codes. Nat Neurosci 16, 264–266 (2013). - PMC - PubMed
    1. Zong W., Wu R., Li M., Hu Y., Li Y., Li J., Rong H., Wu H., Xu Y., Lu Y., Jia H., Fan M., Zhou Z., Zhang Y., Wang A., Chen L., Cheng H., Fast high-resolution miniature two-photon microscopy for brain imaging in freely behaving mice. Nat Methods 14, 713–719 (2017). - PubMed
    1. Klioutchnikov A., Wallace D. J., Sawinski J., Voit K.-M., Groemping Y., Kerr J. N. D., A three-photon head-mounted microscope for imaging all layers of visual cortex in freely moving mice. Nat Methods 20, 610–616 (2023). - PMC - PubMed

Publication types