. 2024 Sep 3;134(17):e178711.
doi: 10.1172/JCI178711.

Recruitment of CXCR4+ type 1 innate lymphoid cells distinguishes sarcoidosis from other skin granulomatous diseases

Affiliations

Recruitment of CXCR4+ type 1 innate lymphoid cells distinguishes sarcoidosis from other skin granulomatous diseases

Satish Sati et al. J Clin Invest. .

Abstract

Sarcoidosis is a multiorgan granulomatous disease that lacks diagnostic biomarkers and targeted treatments. Using blood and skin from patients with sarcoid and non-sarcoid skin granulomas, we discovered that skin granulomas from different diseases exhibit unique immune cell recruitment and molecular signatures. Sarcoid skin granulomas were specifically enriched for type 1 innate lymphoid cells (ILC1s) and B cells and exhibited molecular programs associated with formation of mature tertiary lymphoid structures (TLSs), including increased CXCL12/CXCR4 signaling. Lung sarcoidosis granulomas also displayed similar immune cell recruitment. Thus, granuloma formation was not a generic molecular response. In addition to tissue-specific effects, patients with sarcoidosis exhibited an 8-fold increase in circulating ILC1s, which correlated with treatment status. Multiple immune cell types induced CXCL12/CXCR4 signaling in sarcoidosis, including Th1 T cells, macrophages, and ILCs. Mechanistically, CXCR4 inhibition reduced sarcoidosis-activated immune cell migration, and targeting CXCR4 or total ILCs attenuated granuloma formation in a noninfectious mouse model. Taken together, our results show that ILC1s are a tissue and circulating biomarker that distinguishes sarcoidosis from other skin granulomatous diseases. Repurposing existing CXCR4 inhibitors may offer a new targeted treatment for this devastating disease.

Keywords: Cellular immune response; Dermatology; Immunology; Innate immunity.


Figures
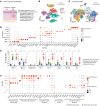
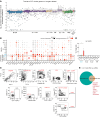
Figure 1
Figure 1. Immune cell landscape in sarcoidosis and non-sarcoidosis skin granulomas.
(A) Overview of sample collection. (B) Identification of cell clusters from patients with sarcoidosis (n = 18 for affected and n = 18 unaffected skin) and non-sarcoidosis skin granuloma patients (n = 10 for affected and n = 9 unaffected skin). VE, vascular endothelium; LE, lymphatic endothelium. (C) UMAP depicting subclustering of immune cells. pDC, plasmacytoid DC; cDC, conventional DC. (D) Marker genes defining immune subsets. Dot size reflects percentage cells expressing the gene, and color illustrates level of gene expression. (E) Box-and-whisker plot shows relative contribution of immune cells as percentage of total cells. In the box-and-whisker plot, the box extends from the 25th to 75th percentile. The line in the middle of the box represents the median, and the whiskers represent the minimum and maximum. All data points are covered, no outlying values. Statistical significance was calculated using a 2-tailed Student’s t test. (F) Dot plot depicting gene activation in different immune clusters. Dot size reflects percentage cells expressing the gene, and color illustrates level of gene expression. Data depicted as mean ± SEM. *P < 0.05; **P < 0.01; ***P < 0.001.
Figure 2
Figure 2. Group 1 ILCs are specifically recruited to sarcoid granulomas.
(A) Gene expression profile of single-cell-identified ILC cluster best matched the ILC definition in the Immunological Genome Project (ImmGen) database. (B) Dot plot comparing gene expression profiles of sarcoidosis immune cells and ILCs to published purified ILC subpopulations. Sarcoidosis ILCs most closely matched ILC1. Dot size reflects percentage cells expressing the gene, and color illustrates level of gene expression. (C) Flow cytometry gating scheme for human ILCs, including NK cells. (D) Flow cytometry analysis of ILC subtypes as percentage of total sorted cells in affected and unaffected sarcoidosis and non-sarcoidosis granuloma skin (n = 3). One-way ANOVA revealed statistical significance for ILC1. *P < 0.05. (E) Comparison of gene expression from flow cytometry–purified sarcoidosis skin ILC1s (n = 3) to sarcoidosis ILCs identified in our scRNA-seq data sets. Eight out of top 10 genes matched and are listed.
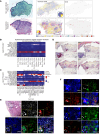
Figure 3
Figure 3. Sarcoid granulomas contain ILC1s and B cell aggregates.
(A) Deconvoluted cell type identification from spatial transcriptomics of patients with sarcoidosis (n = 2) and non-sarcoidosis granuloma (n = 1) patients. Each spot is represented as a pie chart displaying relative cell proportions. The middle panel highlights individual immune cell populations and the right panel highlights ILCs specifically. (B and C) Ligand-receptor analysis of spatial transcriptomics data sets for patients with sarcoidosis and non-sarcoidosis patients. Color represents signaling intensity. (D) Representative immunohistochemistry (n = 7 patients) depicting localization of B cells (CD20, PAX5), T cells (CD3), and macrophages (CD68) in sarcoidosis-affected skin. Dotted box outlines sarcoid granuloma. (E) Representative histology (n = 3 patients) depicting localization of mature germinal center–like B cells (CD3CD20+CD23+, white arrows). Scale bars: 50 μm and 5 μm (yellow insets). (F) Representative histology (n = 3 patients) depicting localization of ILC1 (LinIL7R+Tbet+, white arrowheads). Lineage = CD3CD16CD19CD20CD56CD68 (labeled in green). Scale bars: 100 μm and 10 μm (insets).
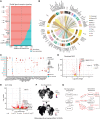
Figure 4
Figure 4. Sarcoid granulomas exhibit molecular features resembling mature tertiary lymphoid structures.
(A) Global analysis of ligand-receptor pathways between sarcoid and non-sarcoid granulomas. Arrows highlight TNF family and CCL signaling. (B) Cell-specific ligand-receptor analysis. Bottom half of circle depicts secreting cell types, and upper half of circle depicts receiving cell types. Inner bottom circle is a summary of the receiving cell types. (C) Dot plot demonstrating average expression (color) and percentage of cells (dot size) expressing specific cytokines. (D) Volcano plot of differential gene expression for sarcoidosis and non-sarcoidosis fibroblasts depicting increased CCL19 and CXCL13 expression. (E) Volcano plot of differential gene expression from bulk RNA-seq of isolated ILC1s from sarcoidosis skin (n = 2) vs. sarcoidosis blood (n = 2), demonstrating increased expression of CCL19 and CXCR4 in skin ILCs. (F) Density plot demonstrating that sarcoidosis-specific B cells express MS4A1 (CD20) and FCER2 (CD23) markers. (G) Summary of unique ligand-receptor interactions found in sarcoid granulomas.
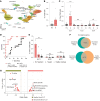
Figure 5
Figure 5. Blood from patients with sarcoidosis contains increased circulating levels of ILC1s.
(A) Identification of cell clusters from blood of patients with sarcoidosis (S, n = 7) and healthy volunteers (HV, n = 6). (B) Scatter plot shows relative contribution of ILCs as percentage of total cells. Statistical significance was calculated using 2-tailed, unpaired Student’s t test. (C) Flow cytometry analysis of ILC subtypes as percentage of total CD45+ cells in healthy volunteers (n = 17), non-sarcoidosis granuloma patients (G, n = 5), and sarcoidosis patient blood (n = 13). One-way ANOVA revealed statistical significance for ILC1: F(2,27) = 19, *P < 0.05, ***P < 0.001; ILC2 and ILC3 were not significant among groups. (D) Receiver operating characteristic (ROC) curves for ILC1 (red) and ILC3 (black) from sarcoidosis patient PBMCs. Area under the curve (AUC) values are listed. (E) Flow cytometry analysis of ILC subtypes as percentage of total CD45+ cells in blood from no-treatment patients (n = 7), treated sarcoid patients (n = 6), and healthy volunteers (n = 17). One-way ANOVA revealed statistical significance for ILC1: F(2,27) = 55, ***P < 0.001; ILC2 and ILC3 are not significant. (F) Comparison of gene expression from bulk RNA-seq analysis of flow cytometry–purified sarcoidosis skin ILC1s (n = 2), sarcoidosis blood ILC1s (n = 2), and healthy volunteer ILC1s (n = 3). (G) Volcano plot of pathway analysis comparing flow cytometry–purified ILC1s from sarcoidosis blood and healthy volunteer blood. Data represented as mean ± SEM. NS, not significant. UPR, unfolded protein response; Ox phos, oxidative phosphorylation.
Figure 6
Figure 6. ILCs are necessary for noninfectious granuloma formation in mice.
(A) Representative histology (n = 2 patients) demonstrating ILCs (LineageIL7R+Tbet+) and recruitment of B cells (CD20+CD23+) and to human lung sarcoid granulomas. Lineage = CD3CD16CD19CD20CD56CD68 (labeled in green). Scale bars: 100 μm and 10 μm (insets). (B) Representative H&E staining depicting granuloma formation in whole lung sections from cadmium nanoparticle–treated WT, Rag2–/–, and Rag2–/– Il2rg–/– (ILC-KO) mice. Inset images show higher magnification. Scale bars: 100 μm. (C) Quantification of lung granulomas (WT, n = 6; Rag2–/–, n = 7; ILC-KO; n = 8). (D) Representative immunofluorescence depicting macrophage (F4/80+) accumulation in lung tissue. Two-tailed, unpaired Student’s t test. Scale bars: 100 μm. The WT macrophages are also shown in Supplemental Figure 10C. (E) Flow cytometry analysis of ILC1 and NK cells as percentage of live CD45+ cells in different mouse genotypes before and after treatment with cadmium nanoparticles (QDOT). WT, n = 6; QDOT-treated, WT, n = 4; Rag2–/–, n = 7; ILC-KO, n = 3. Two-tailed, unpaired Student’s t test, comparing WT mice before and after treatment. Data represented as mean ± SEM. **P < 0.01; ***P < 0.001.
Figure 7
Figure 7. CXCR4 is necessary for ILC1 migration and mouse noninfectious granuloma formation.
(A) Dot plot comparing cytokine ligand and receptor gene expression in sarcoidosis and skin inflammatory diseases. Dot size reflects percentage cells expressing the gene, and color illustrates level of gene expression. MC, molluscum contagiosum; BP, bullous pemphigoid; AE, acrodermatitis enteropathica; AD, atopic dermatitis. (B) Representative spatial transcriptomics depicting CXCR4 and CXCL12 expression in affected sarcoidosis (n = 2), unaffected sarcoidosis (n = 2), psoriasis (n = 3), and healthy volunteer skin (n = 3). (C) Representative immunohistochemistry (n = 3) of CXCL12 depicting expression within sarcoid granulomas. Scale bars: 50 μm. (D) Fold change in CXCL12-mediated migration of CD45+ immune cells from healthy volunteers (HV, n = 4) and sarcoidosis blood (n = 4) with and without CXCR4 inhibitor (plerixafor). Mean ± SEM. Significance was calculated by 2-tailed, paired Student’s t test. (E) H&E staining highlighting pulmonary granuloma formation in lung tissue from cadmium nanoparticle–induced mice treated with PBS or plerixafor. Scale bars: 100 μm. Quantification of lung granuloma formation (n = 5 in each group). Data represented as scatter plots show mean ± SEM. *P < 0.05; ***P < 0.001 by 2-tailed, unpaired Student’s t test.

Comment in

  • Type 1 innate lymphoid cells: a biomarker and therapeutic candidate in sarcoidosis

Similar articles

References

    1. Judson MA, et al. The WASOG Sarcoidosis Organ Assessment Instrument: an update of a previous clinical tool. Sarcoidosis Vasc Diffuse Lung Dis. 2014;31(1):19–27. - PubMed
    1. Crouser ED, et al. Diagnosis and detection of sarcoidosis. An Official American Thoracic Society clinical practice guideline. Am J Respir Crit Care Med. 2020;201(8):e26–e51. doi: 10.1164/rccm.202002-0251ST. - DOI - PMC - PubMed
    1. Iannuzzi MC, et al. Sarcoidosis. N Engl J Med. 2007;357(21):2153–2165. doi: 10.1056/NEJMra071714. - DOI - PubMed
    1. Stanton LA, et al. Immunophenotyping of macrophages in human pulmonary tuberculosis and sarcoidosis. Int J Exp Pathol. 2003;84(6):289–304. doi: 10.1111/j.0959-9673.2003.00365.x. - DOI - PMC - PubMed
    1. Grunewald J, et al. Sarcoidosis. Nat Rev Dis Primers. 2019;5(1):45. doi: 10.1038/s41572-019-0096-x. - DOI - PubMed

MeSH terms