. 2024 Aug 19:15:1407659.
doi: 10.3389/fphar.2024.1407659. eCollection 2024.

Astaxanthin activated the SLC7A11/GPX4 pathway to inhibit ferroptosis and enhance autophagy, ameliorating dry eye disease

Affiliations

Astaxanthin activated the SLC7A11/GPX4 pathway to inhibit ferroptosis and enhance autophagy, ameliorating dry eye disease

Chenting Hou et al. Front Pharmacol. .

Abstract

Dry eye disease (DED) is a common eye disease in clinical practice. The crucial pathogenesis of DED is that hyperosmolarity activates oxidative stress signaling pathways in corneal epithelial and immune cells and, thus, produces inflammatory molecules. The complex pathological changes in the dry eye still need to be elucidated to facilitate treatment. In this study, we found that astaxanthin (AST) can protect against DED through the SLC7A11/GPX4 pathway. After treatment with AST, the SLC7A11/GPX4 pathway was positively activated in DED both in vivo and in vitro, accompanied by enhanced autophagy and decreased ferroptosis. In hyperosmolarity-induced DED corneal epithelial cells, AST increased the expression of ferritin to promote iron storage and reduce Fe2+ overload. It increased glutathione (GSH) and GPX4, scavenged reactive oxygen species (ROS) and lipid peroxide, and rescued the mitochondrial structure to prevent ferroptosis. Furthermore, inhibition of ferroptosis by ferrostatin-1 (Fer-1), iron chelator deferoxamine mesylate (DFO), or AST could activate healthy autophagic flux. In addition, in a dry eye mouse model, AST upregulated SLC7A11 and GPX4 and inhibited ferroptosis. To summarize, we found that AST can ameliorate DED by reinforcing the SLC7A11/GPX4 pathway, which mainly affects oxidative stress, autophagy, and ferroptosis processes.

Keywords: astaxanthin; autophagy; corneal epithelial; dry eye; ferroptosis.


Conflict of interest statement

The authors declare that the research was conducted in the absence of any commercial or financial relationships that could be construed as a potential conflict of interest.

Figures
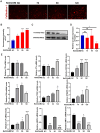
FIGURE 1
FIGURE 1
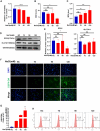
Hyperosmolarity disrupts iron homeostasis in HCECs. (A,B) Western blot analysis of ferritin in HCECs after various concentrations of NaCl for 24 h; protein levels of ferritin were normalized to those of GAPDH. (C) Quantification of fluorescence intensity of Fe2+ specifically detected by FeRhoNox-1 in HCECs. (D) Intracellular Fe2+, 24 h after incubating cells with serial concentrations of NaCl (0, 70, 90, and 120 mM), was visualized by 5 μM FeRhoNox-1 staining coupled with confocal microscopy. Scale bar: 100 μm. (E) qRT-PCR analysis of iron homeostasis-related genes in HCECs exposed to various concentrations of NaCl for 24 h. ns, not significant. *p < 0.05, **p < 0.01, ***p < 0.001, and ****p < 0.0001.
FIGURE 2
FIGURE 2
Hyperosmolarity induces ferroptosis in HCECs. (A) Cell viability 24 h after incubating HCECs with serial concentrations of NaCl (0, 70, 90, and 120 mM), was probed by CCK-8 assay. (B) GSH levels in HCECs after various concentrations of NaCl for 24 h were determined using a GSH assay kit. (C) MDA levels after various concentrations of NaCl for 24 h were detected using an MDA assay kit. (D,E) Western blot analysis of SLC7A11 and GPX4 in HCECs after various concentrations of NaCl for 24 h; protein levels of SLC7A11 and GPX4 were normalized to those of GAPDH. (F) Intracellular ROS generation was visualized using the fluorescent probe DCFH-DA by fluorescence microscopy. Nuclei were stained with DAPI (blue). (G) Levels of ROS in HCECs treated with various concentrations of NaCl for 24 h were assessed by DCFH-DA staining coupled with flow cytometry. (H) Quantification of fluorescence intensity acquired by flow cytometry. Values are shown as the mean ± SD. ns, not significant; *p < 0.05, **p < 0.01, and ***p < 0.001.
FIGURE 3
FIGURE 3
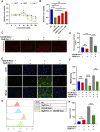
Ferroptosis inhibitor Fer-1 relieves hyperosmolarity-induced ferroptosis in HCECs. (A) Cell viability was determined by CCK-8 assay after pretreating with serial concentrations of Fer-1, DFO, or AST for 24 h. (B) HCEC viability was assessed after pretreating with 5 μM or 10 μM Fer-1 for 6 h and then incubated for 24 h with 120 mM NaCl (DE indicates the dry eye group, treated with 120 mm NaCl). (C) Quantification of fluorescence intensity of Fe2+ detected by FeRhoNox-1. (D) Cells were pretreated with 10 μM Fer-1 for 6 h and incubated with 120 mM NaCl for 24 h. Intracellular Fe2+ was stained with 5 μM FeRhoNox-1 and observed by microscopy. Scale bar: 100 μm. (E) Intracellular ROS was visualized using a fluorescent probe DCFH-DA and fluorescence microscopy. Nuclei were stained blue with DAPI. Scale bar: 100 μm. (F) MDA levels were detected in HCECs, which were pretreated with 10 μM Fer-1 for 6 h and then incubated with 90 or 120 mM NaCl for 24 h. (G) Levels of ROS were assessed by DCFH-DA staining coupled with flow cytometry. (H) Quantification of fluorescence intensity acquired by flow cytometry. ns, not significant; *p < 0.05, **p < 0.01, ***p < 0.001, and ****p < 0.0001.
FIGURE 4
FIGURE 4
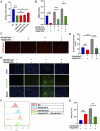
Iron-chelating agent DFO relieves hyperosmolarity-induced ferroptosis in HCECs. (A) HCEC viability was assessed after pretreating with 50 μM or 100 μM DFO for 6 h and then incubated for 24 h with 120 mM NaCl (DE indicates the dry eye group, treated with 120 mm NaCl). (B) MDA levels were detected using an MDA assay kit. HCECs were pretreated with 100 μM DFO for 6 h and then incubated with 90 mM or 120 mM NaCl for 24 h. (C) Intracellular Fe2+ was observed by fluorescence microscopy with 5 μM FeRhoNox-1. Scale bar: 100 μm. (D) Quantification of fluorescence intensity of Fe2+ detected by FeRhoNox-1. (E) Intracellular ROS was visualized using the probe DCFH-DA. HCECs were pretreated with 100 μM DFO for 6 h and then incubated with 120 mM NaCl for 24 h. Nuclei were stained blue with DAPI. Scale bar: 100 μm. (F) Levels of ROS were stained by DCFH-DA with flow cytometry. (G) Quantification of fluorescence intensity acquired by flow cytometry. ns, not significant; *p < 0.05, **p < 0.01, ***p < 0.001, and ****p < 0.0001.
FIGURE 5
FIGURE 5
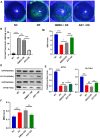
AST relieved hyperosmolarity-induced ferroptosis in HCECs. (A) HCEC viability was assessed after pretreating with 10 μM or 25 μM AST for 6 h and then incubated for 24 h with 120 mM NaCl. (DE indicates the dry eye group, treated with 120 mm NaCl). (B) GSH levels were detected using a GSH assay kit. (C,D) Western blot analysis of SLC7A11, GPX4, and ferritin in HCECs after pretreating with DMSO or 10 μM AST for 6 h and then incubated for 24 h with 120 mM NaCl; protein levels were normalized to those of GAPDH. (E) MDA levels were detected using an MDA assay kit. ns, not significant; *p < 0.05, **p < 0.01, ***p < 0.001, and ****p < 0.0001.
FIGURE 6
FIGURE 6
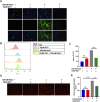
AST relieved hyperosmolarity-induced ferroptosis in HCECs. (A) The production of intracellular ROS was visualized using the fluorescent probe DCFH-DA and fluorescence microscopy. HCECs were pretreated with 10 μM AST for 6 h and then incubated with 120 mM NaCl for 24 h. Nuclei were stained blue with DAPI. Scale bar: 100 μM. (B) Quantification of fluorescence intensity of ROS acquired by flow cytometry. (C) Levels of ROS were stained by DCFH-DA with flow cytometry. (D) Intracellular Fe2+ was observed by fluorescence microscopy with 5 μM FeRhoNox-1. Scale bar: 100 μm. (E) Quantification of the fluorescence intensity of Fe2+ detected by FeRhoNox-1. ns, not significant; *p < 0.05, **p < 0.01, and ***p < 0.001.
FIGURE 7
FIGURE 7
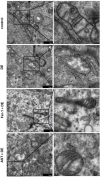
AST relieved the detrimental changes in mitochondrial ultra-structures. The ultra-structures of mitochondria were observed via transmission electron microscopy. The observation indicators included mitochondrial shrinkage, ruptured outer mitochondrial membrane, and reduced or disappeared mitochondrial cristae (DE indicates the dry eye group, treated with 120 mm NaCl).
FIGURE 8
FIGURE 8
Inhibition of ferroptosis can activate autophagy in HCECs. (A–E) Western blot analysis of P62 and LC3B in HCECs after pretreating with DMSO, DFO, Fer-1, or AST for 6 h and then incubated for 24 h with 120 mM NaCl; protein levels were normalized to those of GAPDH. (F) The autophagic flow was detected by transfecting mRFP-GFP-LC3 under confocal microscopy. White triangles show red fluorescence. Scale bar: 50 μm (G). Autophagosomes in HCECs were recorded by transmission electron microscopy. The scale bar was 5 μm; ns indicates not significant; *p < 0.05 and **p < 0.01 (DE indicates the dry eye group, treated with 120 mm NaCl).
FIGURE 9
FIGURE 9
AST inhibits ferroptosis in the dry eye mouse model. (A) Photographs of corneal fluorescein staining. (B) Corneal fluorescein staining score. (C) GSH levels of the corneal tissue were examined using a GSH assay kit. (D,E) Western blot analysis of SLC7A11 and GPX4 in NC, DE, DMSO + DE, and AST + DE groups. GAPDH was used as the loading control. (F) GSH levels of corneal tissue were examined using a GSH assay kit. ns, not significant; *p < 0.05, **p < 0.01, ***p < 0.001, and ****p < 0.0001.
FIGURE 10
FIGURE 10
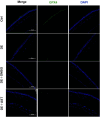
Representative fluorescence images showing the expression of GPX4 in the corneal epithelium of NC, DE, DMSO + DE, and AST + DE mice. Scale bar: 100 μm.
FIGURE 11
FIGURE 11
Summary of the mechanism of hyperosmolarity-induced ferroptosis in corneal epithelial cells and the protective effect of astaxanthin.

Similar articles

References

    1. Aron A. T., Loehr M. O., Bogena J., Chang C. J. (2016). An endoperoxide reactivity-based FRET probe for ratiometric fluorescence imaging of labile iron pools in living cells. J. Am. Chem. Soc. 138 (43), 14338–14346. 10.1021/jacs.6b08016 - DOI - PMC - PubMed
    1. Baudouin C., Aragona P., Messmer E. M., Tomlinson A., Calonge M., Boboridis K. G., et al. (2013). Role of hyperosmolarity in the pathogenesis and management of dry eye disease: proceedings of the OCEAN group meeting. Ocul. Surf. 11 (4), 246–258. 10.1016/j.jtos.2013.07.003 - DOI - PubMed
    1. Cai X., Hua S., Deng J., Du Z., Zhang D., Liu Z., et al. (2022). Astaxanthin activated the Nrf2/HO-1 pathway to enhance autophagy and inhibit ferroptosis, ameliorating acetaminophen-induced liver injury. ACSAppl Mater Interfaces 14 (38), 42887–42903. 10.1021/acsami.2c10506 - DOI - PubMed
    1. Chen C., Chen J., Wang Y., Liu Z., Wu Y. (2021b). Ferroptosis drives photoreceptor degeneration in mice with defects in all-trans-retinal clearance. J. Biol. Chem. 296, 100187. 10.1074/jbc.RA120.015779 - DOI - PMC - PubMed
    1. Chen H., Gan X., Li Y., Gu J., Liu Y., Deng Y., et al. (2020). NLRP12- and NLRC4-mediated corneal epithelial pyroptosis is driven by GSDMD cleavage accompanied by IL-33 processing in dry eye. Ocul. Surf. 18 (4), 783–794. 10.1016/j.jtos.2020.07.001 - DOI - PubMed

Grants and funding

The author(s) declare that financial support was received for the research, authorship, and/or publication of this article. This study was supported by the Natural Science Foundation of Shandong Province (ZR2019MH115) and the Clinical Medicine + X Research Project of the Affiliated Hospital of Qingdao University (QDFY + X202101044).

LinkOut - more resources