. 2024 Aug 8;25(16):8662.
doi: 10.3390/ijms25168662.

Chimeric Antigen Receptor T Cell Bearing Herpes Virus Entry Mediator Co-Stimulatory Signal Domain Exhibits Exhaustion-Resistant Properties

Affiliations

Chimeric Antigen Receptor T Cell Bearing Herpes Virus Entry Mediator Co-Stimulatory Signal Domain Exhibits Exhaustion-Resistant Properties

Jun-Ichi Nunoya et al. Int J Mol Sci. .

Abstract

Improving chimeric antigen receptor (CAR)-T cell therapeutic outcomes and expanding its applicability to solid tumors requires further refinement of CAR-T cells. We previously reported that CAR-T cells bearing a herpes virus entry mediator (HVEM)-derived co-stimulatory signal domain (CSSD) (HVEM-CAR-T cells) exhibit superior functions and characteristics. Here, we conducted comparative analyses to evaluate the impact of different CSSDs on CAR-T cell exhaustion. The results indicated that HVEM-CAR-T cells had significantly lower frequencies of exhausted cells and exhibited the highest proliferation rates upon antigenic stimulation. Furthermore, proliferation inhibition by programmed cell death ligand 1 was stronger in CAR-T cells bearing CD28-derived CSSD (CD28-CAR-T cells) whereas it was weaker in HVEM-CAR-T. Additionally, HVEM-CAR-T cells maintained a low exhaustion level even after antigen-dependent proliferation and exhibited potent killing activities, suggesting that HVEM-CAR-T cells might be less prone to early exhaustion. Analysis of CAR localization on the cell surface revealed that CAR formed clusters in CD28-CAR-T cells whereas uniformly distributed in HVEM-CAR-T cells. Analysis of CD3ζ phosphorylation indicated that CAR-dependent tonic signals were strongly sustained in CD28-CAR-T cells whereas they were significantly weaker in HVEM-CAR-T cells. Collectively, these results suggest that the HVEM-derived CSSD is useful for generating CAR-T cells with exhaustion-resistant properties, which could be effective against solid tumors.

Keywords: T cell exhaustion; T cell-mediated immunotherapy; chimeric antigen receptor; herpes virus entry mediator; tonic signaling.


Conflict of interest statement

The authors declare no conflicts of interest.

Figures
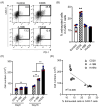
Figure 1
Figure 1
HVEM-CAR-T cells exhibit lower exhaustion phenotype and superior expansion without cognate antigen stimulation. (A) Expression of LAG-3 (y-axis) and PD-1 (x-axis) on each CAR-T cell was analyzed at day 16 post CAR transduction by flow cytometry. Dot plots show representative data from each CAR-T cell population. Numbers in the dot plot show the percentage of LAG-3+/PD-1+ (exhausted) population in the CAR-T cells. (B) The bar graph shows percentages of the exhausted cells (y-axis) among the CAR-T cells at day 16 of CAR transduction. Control shows T cells transduced only with GFP. Each bar shows the mean with standard deviations (SDs) with each data point as an open circle. The results from two separate experiments using primary CD8+ T cells from two different donors (n = 4) are shown. ** p < 0.05 (one-way ANOVA; Tukey post hoc test). (C) The bar graph shows CAR-T cell expansion (y-axis) during culture at day 9 and day 16 of CAR transduction. Each bar shows the mean with SDs with each data point as a filled circle. The results from two separate experiments using primary CD8+ T cells from two different donors (n = 6) are shown in red- or blue-filled circles. ** p < 0.05 (two-way ANOVA; Bonferroni post hoc test). (D) Linear regression analysis between the percentages of expanded CAR-T cell numbers (y-axis) and the percentages of exhausted cells among CAR-T cells (x-axis) at day 16 of the culture are shown.
Figure 2
Figure 2
HVEM-CAR-T cells robustly expand upon cognate antigen stimulation even under immunosuppression by PD-L1. (A) Schematic image for determining CAR-T cell expansion upon cognate antigen stimulation in the presence or absence of PD-L1. CAR-T cells bearing different CSSDs were stimulated with mitomycin C-treated cells (listed in (A), left) and the CAR-T cell proliferation was analyzed using flow cytometry. (B) The graphs show fold expansion of CAR-T cells after first (1st) and second (2nd) stimulation with mitomycin C-treated cells only expressing GFP (labeled as GFP, open circles), GFP and Env (labeled as Env, filled black circles), or GFP and Env and PD-L1 (labeled as Env-PDL1, filled grey circles). (C,D) The bar graph shows fold expansion of CAR-T cells (y-axis) after first (C) and second (D) stimulation with mitomycin C-treated CHO-Env-GFP (left) or CHO-Env-GFP-PD-L1 (right). Each bar shows the mean with SDs with each data point as a filled circle. The results from two separate experiments using primary CD8 T cells from two different donors (n = 4) are shown in red- or blue-filled circles. ** p < 0.05 (one-way ANOVA; Tukey post hoc test).
Figure 3
Figure 3
HVEM-CAR-T cells exhibit less exhausted phenotype even after repeated cognate antigen stimulation. (A) Representative counter plots show LAG-3 (y-axis) and PD-1 (x-axis) expression in CAR-T cells bearing different CSSDs before (pre), after first (1st), and after second (2nd) stimulation using mitomycin C-treated CHO-Env-GFP (labeled as Env) or CHO-Env-GFP-PD-L1 cells (labeled as Env-PDL1). Numbers in the dot plot show the percentage of LAG-3+/PD-1+ (exhausted) population in the CAR-T cells. (B,C) The bar graph shows percentages of the exhausted cells (y-axis) among the CAR-T cells after first (left) and second (right) stimulation with mitomycin C-treated CHO-Env-GFP (B) or CHO-Env-GFP-PD-L1 cells (C). Each bar shows the mean with SDs with each data point as a filled circle. The results from two separate experiments using primary CD8 T cells from two different donors (n = 4) are shown in red- or blue-filled circles. ** p < 0.05 (one-way ANOVA; Tukey post hoc test).
Figure 4
Figure 4
HVEM-CAR-T cells exhibit potent anti-HIV activity. (A) HIV-1-infected CD4+ cells were co-cultured with the control cells or CAR-T cells bearing different CSSDs at E:T ratios of 1:1, 0.1:1, and 0.01:1. FSC (x-axis) and HIV p24 expression (y-axis) were analyzed after 3 days of co-culture by flow cytometry. Dot plots show representative data from each type of CAR-T cell and E:T ratio. Numbers in the dot plot show the percentage of HIV p24+ (HIV-infected) cells in CD8 population. (BD) The bar graph shows percentage of HIV p24+ cells in CD8 population in the co-culture at E:T ratios of 0.01:1 (B), 0.1:1 (C) and 1:1 (D). Control shows T cells transduced only with GFP. Each bar shows the mean with SDs with each data point as a filled circle. The results from two separate experiments using primary CD8+ T cells from two different donors (n = 6) are shown in red- or blue-filled circles. ** p < 0.05 (one-way ANOVA; Tukey post hoc test).
Figure 5
Figure 5
HVEM-CAR-T cells form fewer CAR microclusters in the absence of cognate antigen stimulation. Imaging analysis of cell surface CAR distributions on sorted CAR-T cells bearing different CSSDs at day 9 (A,B) and day 24 (C,D) after CAR transduction. The representative phase contrast (upper) and CAR (lower) images at day 9 (A) and day 24 (C) are shown. White arrowhead in each image shows the representative morphology of a CAR microcluster. Scale bars = 25 μm. Bar graph shows the number of CAR-T cells with CAR puncta at day 9 (B) and day 24 (D). Data of 100 randomly chosen CAR-T cells in each image are shown. Each bar shows the mean with standard deviations with each data point as a filled circle. The results from two separate experiments with primary CD8+ T cells from two different donors (n = 8) are shown in red- or blue-filled circles. ** p < 0.05 (one-way ANOVA; Tukey post hoc test).
Figure 6
Figure 6
HVEM-CAR-T cells exhibit lower CAR-mediated tonic signaling in the absence of cognate antigen stimulation. (A) Panels show a typical phosphorylated CD3ζ histogram of the successfully transduced GFP+ populations of the CAR-T cells bearing different CSSDs at day 9 and day 16 analyzed by flow cytometry. (B) Bar graphs show the MFI of phosphorylated CD3ζ in the GFP+ populations of control T cells or CAR-T cells bearing different CSSDs at day 9 (left) and day 16 (right). Each bar shows the mean with SDs with each data point as a filled circle. The results from two separate experiments with primary CD8+ T cells from two different donors (n = 6) are shown in red- or blue-filled circles. ** p < 0.05 (two-way ANOVA; Bonferroni post hoc test).

Similar articles

References

    1. Maude S.L., Teachey D.T., Porter D.L., Grupp S.A. CD19-targeted chimeric antigen receptor T-cell therapy for acute lymphoblastic leukemia. Blood. 2015;125:4017–4023. doi: 10.1182/blood-2014-12-580068. - DOI - PMC - PubMed
    1. Newick K., O’Brien S., Moon E., Albelda S.M. CAR T Cell Therapy for Solid Tumors. Annu. Rev. Med. 2017;68:139–152. doi: 10.1146/annurev-med-062315-120245. - DOI - PubMed
    1. Maude S.L., Laetsch T.W., Buechner J., Rives S., Boyer M., Bittencourt H., Bader P., Verneris M.R., Stefanski H.E., Myers G.D., et al. Tisagenlecleucel in Children and Young Adults with B-Cell Lymphoblastic Leukemia. N. Engl. J. Med. 2018;378:439–448. doi: 10.1056/NEJMoa1709866. - DOI - PMC - PubMed
    1. Rafiq S., Hackett C.S., Brentjens R.J. Engineering strategies to overcome the current roadblocks in CAR T cell therapy. Nat. Rev. Clin. Oncol. 2020;17:147–167. doi: 10.1038/s41571-019-0297-y. - DOI - PMC - PubMed
    1. Dotti G., Gottschalk S., Savoldo B., Brenner M.K. Design and development of therapies using chimeric antigen receptor-expressing T cells. Immunol. Rev. 2014;257:107–126. doi: 10.1111/imr.12131. - DOI - PMC - PubMed

MeSH terms

Substances

LinkOut - more resources