Glut1 Functions in Insulin-Producing Neurons to Regulate Lipid and Carbohydrate Storage in Drosophila
- PMID: 39199423
- PMCID: PMC11353170
- DOI: 10.3390/biom14081037
Glut1 Functions in Insulin-Producing Neurons to Regulate Lipid and Carbohydrate Storage in Drosophila
Abstract
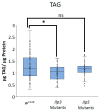
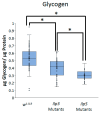
Obesity remains one of the largest health problems in the world, arising from the excess storage of triglycerides (TAGs). However, the full complement of genes that are important for regulating TAG storage is not known. The Glut1 gene encodes a Drosophila glucose transporter that has been identified as a potential obesity gene through genetic screening. Yet, the tissue-specific metabolic functions of Glut1 are not fully understood. Here, we characterized the role of Glut1 in the fly brain by decreasing neuronal Glut1 levels with RNAi and measuring glycogen and TAGs. Glut1RNAi flies had decreased TAG and glycogen levels, suggesting a nonautonomous role of Glut1 in the fly brain to regulate nutrient storage. A group of hormones that regulate metabolism and are expressed in the fly brain are Drosophila insulin-like peptides (Ilps) 2, 3, and 5. Interestingly, we observed blunted Ilp3 and Ilp5 expression in neuronal Glut1RNAi flies, suggesting Glut1 functions in insulin-producing neurons (IPCs) to regulate whole-organism TAG and glycogen storage. Consistent with this hypothesis, we also saw fewer TAGs and glycogens and decreased expression of Ilp3 and Ilp5 in flies with IPC-specific Glut1RNAi. Together, these data suggest Glut1 functions as a nutrient sensor in IPCs, controlling TAG and glycogen storage and regulating systemic energy homeostasis.
Keywords: Drosophila; Glut1; Ilp3; Ilp5; TAG; glycogen; neurons.
Conflict of interest statement
The authors declare no conflicts of interest. The funders had no role in the design of the study; in the collection, analyses, or interpretation of data; in the writing of the manuscript; or in the decision to publish the results.
Figures


Similar articles
-
Mio acts in the Drosophila brain to control nutrient storage and feeding.Gene. 2015 Sep 1;568(2):190-5. doi: 10.1016/j.gene.2015.05.055. Epub 2015 May 27. Gene. 2015. PMID: 26024590 Free PMC article.
-
Identified peptidergic neurons in the Drosophila brain regulate insulin-producing cells, stress responses and metabolism by coexpressed short neuropeptide F and corazonin.Cell Mol Life Sci. 2012 Dec;69(23):4051-66. doi: 10.1007/s00018-012-1097-z. Epub 2012 Jul 25. Cell Mol Life Sci. 2012. PMID: 22828865 Free PMC article.
-
Expression of a constitutively active insulin receptor in Drosulfakinin (Dsk) neurons regulates metabolism and sleep in Drosophila.Biochem Biophys Rep. 2022 May 14;30:101280. doi: 10.1016/j.bbrep.2022.101280. eCollection 2022 Jul. Biochem Biophys Rep. 2022. PMID: 35600902 Free PMC article.
-
Insulin/IGF signaling in Drosophila and other insects: factors that regulate production, release and post-release action of the insulin-like peptides.Cell Mol Life Sci. 2016 Jan;73(2):271-90. doi: 10.1007/s00018-015-2063-3. Epub 2015 Oct 15. Cell Mol Life Sci. 2016. PMID: 26472340 Free PMC article. Review.
-
Factors that regulate expression patterns of insulin-like peptides and their association with physiological and metabolic traits in Drosophila.Insect Biochem Mol Biol. 2021 Aug;135:103609. doi: 10.1016/j.ibmb.2021.103609. Epub 2021 Jun 17. Insect Biochem Mol Biol. 2021. PMID: 34146686 Review.
References
-
- Hales C.M., Carroll M.D., Fryar C.D., Ogden C.L. Prevalence of Obesity and Severe Obesity among Adults: United States, 2017–2018. National Center for Health Statistics; Hyattsville, MD, USA: 2020. pp. 1–8. NCHS Data Brief No. 360.
MeSH terms
Substances
Grants and funding
LinkOut - more resources
Full Text Sources
Medical
Molecular Biology Databases
Miscellaneous

