Proteomics and Bioinformatics Identify Drug-Resistant-Related Genes with Prognostic Potential in Cholangiocarcinoma
- PMID: 39199357
- PMCID: PMC11352417
- DOI: 10.3390/biom14080969
Proteomics and Bioinformatics Identify Drug-Resistant-Related Genes with Prognostic Potential in Cholangiocarcinoma
Abstract
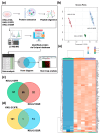
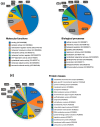
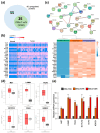
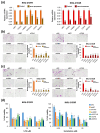
Drug resistance is a major challenge in the treatment of advanced cholangiocarcinoma (CCA). Understanding the mechanisms of drug resistance can aid in identifying novel prognostic biomarkers and therapeutic targets to improve treatment efficacy. This study established 5-fluorouracil- (5-FU) and gemcitabine-resistant CCA cell lines, KKU-213FR and KKU-213GR, and utilized comparative proteomics to identify differentially expressed proteins in drug-resistant cells compared to parental cells. Additionally, bioinformatics analyses were conducted to explore the biological and clinical significance of key proteins. The drug-resistant phenotypes of KKU-213FR and KKU-213GR cell lines were confirmed. In addition, these cells demonstrated increased migration and invasion abilities. Proteomics analysis identified 81 differentially expressed proteins in drug-resistant cells, primarily related to binding functions, biological regulation, and metabolic processes. Protein-protein interaction analysis revealed a highly interconnected network involving MET, LAMB1, ITGA3, NOTCH2, CDH2, and NDRG1. siRNA-mediated knockdown of these genes in drug-resistant cell lines attenuated cell migration and cell invasion abilities and increased sensitivity to 5-FU and gemcitabine. The mRNA expression of these genes is upregulated in CCA patient samples and is associated with poor prognosis in gastrointestinal cancers. Furthermore, the functions of these proteins are closely related to the epithelial-mesenchymal transition (EMT) pathway. These findings elucidate the potential molecular mechanisms underlying drug resistance and tumor progression in CCA, providing insights into potential therapeutic targets.
Keywords: 5-fluorouracil; EMT; cholangiocarcinoma; drug resistance; gemcitabine; quantitative proteomics.
Conflict of interest statement
The authors declare no conflicts of interest.
Figures


Similar articles
-
Knockdown of cullin 3 inhibits progressive phenotypes and increases chemosensitivity in cholangiocarcinoma cells.Mol Med Rep. 2024 Nov;30(5):198. doi: 10.3892/mmr.2024.13322. Epub 2024 Sep 6. Mol Med Rep. 2024. PMID: 39239747 Free PMC article.
-
Long non-coding RNA LINC00665 promotes gemcitabine resistance of Cholangiocarcinoma cells via regulating EMT and stemness properties through miR-424-5p/BCL9L axis.Cell Death Dis. 2021 Jan 12;12(1):72. doi: 10.1038/s41419-020-03346-4. Cell Death Dis. 2021. PMID: 33436545 Free PMC article.
-
Quantitative proteomics analysis reveals possible anticancer mechanisms of 5'-deoxy-5'-methylthioadenosine in cholangiocarcinoma cells.PLoS One. 2024 Jun 26;19(6):e0306060. doi: 10.1371/journal.pone.0306060. eCollection 2024. PLoS One. 2024. PMID: 38923999 Free PMC article.
-
Inhibition of FGFR2 enhances chemosensitivity to gemcitabine in cholangiocarcinoma through the AKT/mTOR and EMT signaling pathways.Life Sci. 2022 May 1;296:120427. doi: 10.1016/j.lfs.2022.120427. Epub 2022 Feb 23. Life Sci. 2022. PMID: 35218764
-
The Emerging Role of MicroRNAs in Regulating the Drug Response of Cholangiocarcinoma.Biomolecules. 2020 Sep 30;10(10):1396. doi: 10.3390/biom10101396. Biomolecules. 2020. PMID: 33007962 Free PMC article. Review.
Cited by
-
Knockdown of cullin 3 inhibits progressive phenotypes and increases chemosensitivity in cholangiocarcinoma cells.Mol Med Rep. 2024 Nov;30(5):198. doi: 10.3892/mmr.2024.13322. Epub 2024 Sep 6. Mol Med Rep. 2024. PMID: 39239747 Free PMC article.
References
-
- Banales J.M., Marin J.J., Lamarca A., Rodrigues P.M., Khan S.A., Roberts L.R., Cardinale V., Carpino G., Andersen J.B., Braconi C. Cholangiocarcinoma 2020: The next horizon in mechanisms and management. Nat. Rev. Gastroenterol. Hepatol. 2020;17:557–588. doi: 10.1038/s41575-020-0310-z. - DOI - PMC - PubMed
-
- Tawarungruang C., Khuntikeo N., Chamadol N., Laopaiboon V., Thuanman J., Thinkhamrop K., Kelly M., Thinkhamrop B. Survival after surgery among patients with cholangiocarcinoma in Northeast Thailand according to anatomical and morphological classification. BMC Cancer. 2021;21:497. doi: 10.1186/s12885-021-08247-z. - DOI - PMC - PubMed
MeSH terms
Substances
Grants and funding
LinkOut - more resources
Full Text Sources
Medical
Research Materials
Miscellaneous

