. 2024 Aug 30;10(35):eadp0975.
doi: 10.1126/sciadv.adp0975. Epub 2024 Aug 28.

Cancer-associated DNA hypermethylation of Polycomb targets requires DNMT3A dual recognition of histone H2AK119 ubiquitination and the nucleosome acidic patch

Affiliations

Cancer-associated DNA hypermethylation of Polycomb targets requires DNMT3A dual recognition of histone H2AK119 ubiquitination and the nucleosome acidic patch

Kristjan H Gretarsson et al. Sci Adv. .

Abstract

During tumor development, promoter CpG islands that are normally silenced by Polycomb repressive complexes (PRCs) become DNA-hypermethylated. The molecular mechanism by which de novo DNA methyltransferase(s) [DNMT(s)] catalyze CpG methylation at PRC-regulated regions remains unclear. Here, we report a cryo-electron microscopy structure of the DNMT3A long isoform (DNMT3A1) amino-terminal region in complex with a nucleosome carrying PRC1-mediated histone H2A lysine-119 monoubiquitination (H2AK119Ub). We identify regions within the DNMT3A1 amino terminus that bind H2AK119Ub and the nucleosome acidic patch. This bidentate interaction is required for effective DNMT3A1 engagement with H2AK119Ub-modified chromatin in cells. Further, aberrant redistribution of DNMT3A1 to Polycomb target genes recapitulates the cancer-associated DNA hypermethylation signature and inhibits their transcriptional activation during cell differentiation. This effect is rescued by disruption of the DNMT3A1-acidic patch interaction. Together, our analyses reveal a binding interface critical for mediating promoter CpG island DNA hypermethylation, a major molecular hallmark of cancer.


Figures

Fig. 1.
Fig. 1.. Identification of critical regions within N terminus of DNMT3A1 for DNMT3A1-H2AK119Ub interaction.
(A) Representative IF staining of FLAG-DNMT3A1 in 10T cells expressing DNMT3A1WT, DNMT3A1W330R (compromising the PWWP domain), or DNMT3A1W330R with four–to eight–amino acid deletions within the UDR domain [∆R1, ∆R3, ∆R5, and ∆R6: see (C) for more detail]. (B) Quantification of FLAG-DNMT3A1 IF in 10T cells expressing DNMT3A1WT, DNMT3A1W330R, or DNMT3A1W330R with ∆R1 to ∆R7. Left: Ratio of 10T cells displaying DNMT3A1 Xi accumulation compared to all 10T cells. Right: Ratio of 10T cells displaying DNMT3A1 cytoplasmic localization compared to all 10T cells. Error bars represent SD of five replicates. Student’s t test, (ns) P > 0.05, **P < 0.01, and ***P < 0.001. (C) Amino acid sequence of the DNMT3A1 UDR domain (amino acids 159 to 228). Regions subject to deletion analysis in (A) (R1 to R7) are indicated at top. Interaction surfaces for the nucleosome acidic patch and Ub are indicated at bottom. (D) Cryo-EM map of DNMT3A1 N-terminal region (amino acids 159 to 228) bound to H2AK119Ub nucleosome. (E) Portion of the cryo-EM map highlighting various regions within DNMT3A1 UDR domain [colored as per (C)] and Ub, shown at two different views. AP, acidic patch.
Fig. 2.
Fig. 2.. DNMT3A1 UDR domain binds to H2AK119Ub nucleosome via dual recognition of acidic patch and Ub.
(A) Close-up view of the interactions between the N-terminal region of DNMT3A1 and acidic patch of the nucleosome. (B) Top: Amino acid sequence of the UDR peptide for WT, triple acidic patch mutants (R167E, R171E, and R181E), single acidic patch mutant (R181E), and Ub mutants (W207A, L208A, and W210A). Bottom: dCypher Luminex assay to measure interaction between 6×His-tagged UDR peptides (WT or mutant as noted: the Queries) and a multiplexed panel of fully defined nucleosomes (the Targets; unmodified or with diverse KUb: H2AK15Ub1, H2AK119Ub1, H2AK129Ub1, H2BK120Ub1, H3K14Ub1, or H2BK18Ub1). A four-parameter logistic equation where X is log(peptide concentration) was applied. (C) Left: Representative IF of FLAG-DNMT3A1 in 10T cells expressing DNMT3A1WT, DNMT3A1W330R (PWWP mutant) DNMT3A1W330R+R181E or DNMT3A1W330R+Ub mut. Right: Quantification of FLAG-DNMT3A1 IF in 10T cells expressing DNMT3A1WT, DNMT3A1W330R, DNMT3A1W330R+R181E or DNMT3A1W330R+Ub mut, shown as ratio of 10T cells displaying DNMT3A1 Xi accumulation compared to all 10T cells. Error bars represent SD of five replicates. Student’s t test, **P < 0.01, and ***P < 0.001.
Fig. 3.
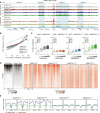
Fig. 3.. Genomic targeting of DNMT3A1 is regulated by its interface with H2AK119Ub and nucleosome acidic patch.
(A) Genome browser view (at chromosome 1, 137.7 to 139.8 Mb, GRCm38) of DNMT3A1 ChIP-seq reads for DNMT3A1WT, DNMT3A1W330R, DNMT3A1R181E, and DNMT3A1Ub mut QKO mESCs. CUT&RUN reads for H3K4me3, H3K27me3, H2AK119Ub, and H3K36me2 in DNMT3A1WT QKO mESCs are also shown. Genes from RefSeq database are annotated at the bottom. (B) CUT&RUN reads per 1000 averaged 1-kb bin for H3K27me3 and ChIP-seq reads per 1000 averaged 1-kb bin for DNMT3A1 in DNMT3A1WT, DNMT3A1W330R, DNMT3A1R181E, and DNMT3A1Ub mut QKO mESCs. To generate 1000 rank-ordered bins, 1-kb genomic tiles were ranked by H3K36me2 enrichment in DNMT3A1WT QKO mESC and grouped. (C) Percent of DNAme (EM-seq) in DNMT3A1WT, DNMT3A1W330R, DNMT3A1R181E, and DNMT3A1Ub mut QKO mESCs per 10,000 bins grouped by H3K36me2 CUT&RUN enrichment [Q1 (lowest) to Q4 (highest)]. (D) Enrichment heat map of H3K27me3 and H3K36me2 CUT&RUN reads in DNMT3A1WT QKO mESCs and DNMT3A1 ChIP-seq reads in DNMT3A1WT, DNMT3A1W330R, DNMT3A1R181E, and DNMT3A1Ub mut QKO mESCs sorted by H3K27me3 centered at CGIs ± 5 kb. (E) Enrichment plot of ChIP-seq reads of DNMT3A1 in DNMT3A1WT, DNMT3A1W330R, DNMT3A1R181E, and DNMT3A1Ub mut QKO mESCs centered at CGIs ± 5 kb and grouped into the highest 20% H2AK119Ub-enriched CGIs (H2AK119Ub+) and the lowest 80% H2AK119Ub-enriched CGIs (H2AK119Ub).
Fig. 4.
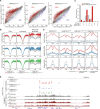
Fig. 4.. Polycomb promoter hypermethylation following DNMT3A1 redistribution requires DNMT3A1 interaction with the nucleosome acidic patch and H2AK119Ub.
(A) Scatter plots showing the percentage of DNAme (by RRBS) at promoters [TSS ± 500 base pairs (bp)] in DNMT3A1W330R, DNMT3AW330R+181E, and DNMT3A1W330R+Ub mut versus DNMT3A1WT-expressing 10T cells. Each dot represents a single promoter. Significantly hypermethylated (>10% and q < 0.01) and hypomethylated (<−10% and q < 0.01) promoters are colored in red and blue, respectively (two biological replicates). (B) Metagene plot showing the percentage of DNAme over CGIs ± 5 kb (left), promoters (TSS ± 5 kb) (middle), and Polycomb-regulated promoters (H3K27me3+ and H2AK119Ub+) (right) in DNMT3A1W330R, DNMT3AW330R+R181E, and DNMT3A1W330R+Ub mut compared to DNMT3A1WT 10T cells. (C) Bar plot showing representation among all promoters, or 10T DNMT3AW330R–hypermethylated promoters, for each group of promoters defined by histone PTM status in control cells as in fig. S6B. (D) Metagene plot showing enrichment of H2AK119Ub, H3K27me3, and H3K4me3 CUT&RUN reads from DNMT3A1WT, DNMT3A1W330R, DNMT3AW330R+R181E, and DNMT3A1W330R+Ub mut 10T cells, centered at TSS ± 5 kb, and grouped by all, hypermethylated, and hypomethylated promoters. (E) Genome browser view (chromosome 2, 74.5 to 75.0 Mb), showing differences in the percentage of DNAme (by RRBS) between DNMT3A1WT and various mutant 10T cells. Bottom: H2AK119Ub, H3K27me3, and H3K4me3 CUT&RUN reads from DNMT3A1WT and DNMT3A1W330R 10T cells. Genes from RefSeq database are annotated at the bottom.
Fig. 5.
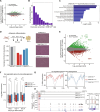
Fig. 5.. Increased DNAme at Polycomb CGIs impairs differentiation-induced transcriptional activation of target genes.
(A) MA plot comparing log10 of average normalized reads per gene versus log2 fold change (LFC) in gene expression between DNMT3A1W330R and DNMT3A1WT. Significantly differentially expressed genes are highlighted in green (LFC > 2 and q < 0.01) or red (LFC < −2 and q < 0.01) (two biological replicates). (B) Bar plot showing distribution of 10T DNMT3A1W330R–hypermethylated genes into gene expression deciles in DNMT3A1WT 10T cells. (C) Bar plot of log10 P values of select GO terms of 10T DNMT3A1W330R–hypermethylated genes. (D) Top: Schematic of 10T differentiation to adipocytes. Bottom: Bar plot of normalized Red Oil O absorption in day 10 adipocytes. Representative images of Red Oil O staining are shown. (E) MA plot comparing log10 of average normalized reads per gene in DNMT3A1WT undifferentiated and day 6 adipocyte-differentiated 10T cells versus LFC in gene expression. Significantly differently expressed genes are highlighted in green [LFC > 2 and false discovery rate (FDR) < 0.01] or red (LFC < −2 and FDR < 0.01) (two biological replicates). (F) Gene expression (log2 RPM) box plot of top 500 up-regulated genes in adipocytes from days 2 to 6 (two biological replicates). Student’s t test, (ns) P > 0.05, *P < 0.05, **P < 0.01, and ***P < 0.001. (G) Enrichment plot showing the distribution of the percentage of DNAme over the promoters of up-regulated genes during adipogenesis for DNMT3A1WT, DNMT3A1W330R, and DNMT3AW330R+181E undifferentiated 10T cells. (H) Genome browser view of the percentage of DNAme and gene expression of undifferentiated and day 6 adipocyte-differentiated DNMT3A1WT, DNMT3A1W330R, and DNMT3AW330R+181E 10T cells over Lpl. Right: Average DNAme at Lpl promoter.
Fig. 6.
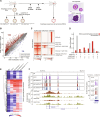
Fig. 6.. Cancer-associated Polycomb CGI hypermethylation requires DNMT3A1–acidic patch interaction.
(A) Schematic of EN- and 4NQO-induced ESCC organoid collection. Right: Representative images of EN and ESCC organoid histology. (B) Scatter plots showing the percentage of DNAme (by RRBS) at all promoters (TSS ± 500 bp) in ESCC versus EN organoids. Each dot represents a single promoter. Significantly hypermethylated (>10% and q < 0.01) and hypomethylated (<−10% and q < 0.01) promoters are respectively colored in red and blue (three biological replicates), respectively. (C) Heatmap showing enrichment of H3K27me3, H2AK119Ub, and H3K4me3 CUT&Tag reads at all promoters (TSS ± 5 kb) in EN organoids. Promoters are classified to six groups: H3K4me3+; H3K27me3+; H2AK119Ub+; H3K4me3+ and H2AK119Ub+; H3K27me3+ and H2AK119Ub+; and H3K4me3+, H3K27me3+, and H2AK119Ub+. (D) Bar plots showing the representation among all promoters, or ESCC-hypermethylated promoters, for each promoter group defined in (C). (E) Heatmap showing the percentage of promoter DNAme (by RRBS) in EN organoids, ESCC organoids, and EN organoids expressing DNMT3A1WT, DNMT3A1W330R, and DNMT3A1W330R+R181E for all ESCC-hypermethylated promoters. (F) Genome browser view of Cdkn2a (chromosome 4, 89,187 to 89,216 Mb, GRCm39), showing the percentage of DNAme (by RRBS) in EN organoids, ESCC organoids, and EN organoids expressing DNMT3A1WT, DNMT3A1W330R, and DNMT3A1W330R+R181E. Bottom: H3K27me3 and H2AK119Ub CUT&Tag reads in EN and ESCC organoids. Right: Average DNAme at Cdkn2a promoter (chromosome 4, 89,200,200 to 89,200,300 bp, GRCm39). Genes from RefSeq database are annotated at the bottom.

Update of

Similar articles

Cited by

References

    1. Baylin S. B., Jones P. A., Epigenetic determinants of cancer. Cold Spring Harb. Perspect. Biol. 8, a019505 (2016). - PMC - PubMed
    1. Zhou W., Dinh H. Q., Ramjan Z., Weisenberger D. J., Nicolet C. M., Shen H., Laird P. W., Berman B. P., DNA methylation loss in late-replicating domains is linked to mitotic cell division. Nat. Genet. 50, 591–602 (2018). - PMC - PubMed
    1. Deaton A. M., Bird A., CpG islands and the regulation of transcription. Genes Dev. 25, 1010–1022 (2011). - PMC - PubMed
    1. Feinberg A. P., Cui H., Ohlsson R., DNA methylation and genomic imprinting: Insights from cancer into epigenetic mechanisms. Semin. Cancer Biol. 12, 389–398 (2002). - PubMed
    1. Toyota M., Ahuja N., Ohe-Toyota M., Herman J. G., Baylin S. B., Issa J.-P. J., CpG island methylator phenotype in colorectal cancer. Proc. Natl. Acad. Sci. U.S.A. 96, 8681–8686 (1999). - PMC - PubMed

LinkOut - more resources