Establishment of a prognostic model for pancreatic cancer based on mitochondrial metabolism related genes
- PMID: 39196457
- PMCID: PMC11358576
- DOI: 10.1007/s12672-024-01255-y
Establishment of a prognostic model for pancreatic cancer based on mitochondrial metabolism related genes
Abstract
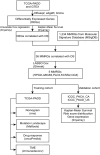
Aim: Pancreatic ductal adenocarcinoma (PAAD) is recognized as an exceptionally aggressive cancer that both highly lethal and unfavorable prognosis. The mitochondrial metabolism pathway is intimately involved in oncogenesis and tumor progression, however, much remains unknown in this area. In this study, the bioinformatic tools have been used to construct a prognostic model with mitochondrial metabolism-related genes (MMRGs) to evaluate the survival, immune status, mutation profile, and drug sensitivity of PAAD patients.
Method: Univariate Cox regression and LASSO regression were used to screen the differentially expressed genes (DEGs), and multivariate Cox regression was used to develop the risk model. Kaplan-Meier estimator was employed to identify MMRGs signatures associated with overall survival (OS). ROC curves were utilized to evaluate the model's performance. Maftools, immunedeconv and CIBERSORT R packages were applied to analyze the gene mutation profiles and immune status. The corresponding sensitivity to pharmaceutical agents was assessed using oncoPredict R packages.
Results: A prognostic model with five MMRGs was developed, which defined the patients as high-risk showed lower survival rates. There was good consistency among individuals categorized as high-risk, showing elevated rates of genetic alterations, particularly in the TP53 and KRAS genes. Furthermore, these patients exhibited increased levels of immunosuppression, characterized by an increased presence of macrophages, neutrophils, Th2 cells, and regulatory T cells. Additionally, high-risk patients showed increased sensitivity to Sabutoclax and Venetoclax.
Conclusion: By utilizing a gene signature associated with mitochondrial metabolism, a prognostic model has been established which could be a highly efficient method for predicting the outcomes of PAAD patients.
Keywords: Bioinformatic; Mitochondrial metabolism related genes; Pancreatic ductal adenocarcinoma; Risk model.
© 2024. The Author(s).
Conflict of interest statement
The authors declare no competing interests.
Figures


Similar articles
-
Mitochondrial energy metabolism-related gene signature as a prognostic indicator for pancreatic adenocarcinoma.Front Pharmacol. 2024 Mar 20;15:1332042. doi: 10.3389/fphar.2024.1332042. eCollection 2024. Front Pharmacol. 2024. PMID: 38572434 Free PMC article.
-
Identification of a Four Cancer Stem Cell-Related Gene Signature and Establishment of a Prognostic Nomogram Predicting Overall Survival of Pancreatic Adenocarcinoma.Comb Chem High Throughput Screen. 2022;25(12):2070-2081. doi: 10.2174/1386207325666220113142212. Comb Chem High Throughput Screen. 2022. PMID: 35048799
-
Integrated bioinformatic analysis of mitochondrial metabolism-related genes in acute myeloid leukemia.Front Immunol. 2023 Apr 17;14:1120670. doi: 10.3389/fimmu.2023.1120670. eCollection 2023. Front Immunol. 2023. PMID: 37138869 Free PMC article.
-
Development and Validation of an Inflammatory Response-Related Gene Signature for Predicting the Prognosis of Pancreatic Adenocarcinoma.Inflammation. 2022 Aug;45(4):1732-1751. doi: 10.1007/s10753-022-01657-6. Epub 2022 Mar 23. Inflammation. 2022. PMID: 35322324
-
Identify potential prognostic indicators and tumor-infiltrating immune cells in pancreatic adenocarcinoma.Biosci Rep. 2022 Feb 25;42(2):BSR20212523. doi: 10.1042/BSR20212523. Biosci Rep. 2022. PMID: 35083488 Free PMC article. Review.
References
-
- De Luca R, Gianotti L, Pedrazzoli P, Brunetti O, Rizzo A, Sandini M, Paiella S, Pecorelli N, Pugliese L, Pietrabissa A, Zerbi A, Salvia R, Boggi U, Casirati A, Falconi M, Caccialanza R. Immunonutrition and prehabilitation in pancreatic cancer surgery: a new concept in the era of ERAS® and neoadjuvant treatment. Eur J Surg Oncol. 2023;49(3):542–9. 10.1016/j.ejso.2022.12.006. 10.1016/j.ejso.2022.12.006 - DOI - PubMed
-
- Di Federico A, Mosca M, Pagani R, Carloni R, Frega G, De Giglio A, Rizzo A, Ricci D, Tavolari S, Di Marco M, Palloni A, Brandi G. Immunotherapy in pancreatic cancer: why do we keep failing? A focus on tumor immune microenvironment, predictive biomarkers and treatment outcomes. Cancers (Basel). 2022;14(10):2429. 10.3390/cancers14102429. 10.3390/cancers14102429 - DOI - PMC - PubMed
LinkOut - more resources
Full Text Sources
Research Materials
Miscellaneous
