. 2024 Jul;3(7):869-882.
doi: 10.1038/s44161-024-00502-3. Epub 2024 Jul 5.

Nuclear ATP-citrate lyase regulates chromatin-dependent activation and maintenance of the myofibroblast gene program

Affiliations

Nuclear ATP-citrate lyase regulates chromatin-dependent activation and maintenance of the myofibroblast gene program

Michael P Lazaropoulos et al. Nat Cardiovasc Res. 2024 Jul.

Abstract

Differentiation of cardiac fibroblasts to myofibroblasts is necessary for matrix remodeling and fibrosis in heart failure. We previously reported that mitochondrial calcium signaling drives α-ketoglutarate-dependent histone demethylation, promoting myofibroblast formation. Here we investigate the role of ATP-citrate lyase (ACLY), a key enzyme for acetyl-CoA biosynthesis, in histone acetylation regulating myofibroblast fate and persistence in cardiac fibrosis. We show that inactivation of ACLY prevents myofibroblast differentiation and reverses myofibroblasts towards quiescence. Genetic deletion of Acly in post-activated myofibroblasts prevents fibrosis and preserves cardiac function in pressure-overload heart failure. TGFβ stimulation enhances ACLY nuclear localization and ACLY-SMAD2/3 interaction, and increases H3K27ac at fibrotic gene loci. Pharmacological inhibition of ACLY or forced nuclear expression of a dominant-negative ACLY mutant prevents myofibroblast formation and H3K27ac. Our data indicate that nuclear ACLY activity is necessary for myofibroblast differentiation and persistence by maintaining histone acetylation at TGFβ-induced myofibroblast genes. These findings provide targets to prevent and reverse pathological fibrosis.


Conflict of interest statement

The authors declare no competing interests.

Figures

Fig. 1
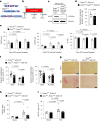
Fig. 1. Increased ACLY activity is necessary for myofibroblast differentiation.
a, Western blot of mouse CFs with and without TGFβ treatment for 48 h. Immunoblots of pSer455–ACLY (pACLY), ACLY and αTubulin (αTub), loading control (load con). b, pACLY to total ACLY (tACLY) protein expression, band intensity (arbitrary units) ratio normalized to αTub from a. Unpaired two-sided t-test. c, Western blot of CFs treated with and without TGFβ for 0–24 h. Immunoblots for pACLY, ACLY, POSTN, COL1A1 and αTub. d, Correlation of POSTN and the pACLY:tACLY ratio (n = 3 biological replicates per timepoint). e, Western blot of COL1A1, POSTN and αTub (load con). CFs were transduced with adenovirus expressing Cre or βgal and treated with TGFβ or vehicle (Con). f, COL1A1 and POSTN protein expression normalized to αTub. g, Myofibroblasts identified by αSMA immunostaining (red), co-stained with DAPI (blue). Scale bars, 50 μm. h, Percentage of αSMA+ cells. i, qPCR mRNA expression of Acta2 and Col1a1. j, CFs treated with ACLYi (BMS-303141, 4 μM) or veh, with or without 10 ng ml−1 TGFβ, for 48 h; immunoblots of COL1A1 and αTub (load con). k, COL1A1 protein expression normalized to αTub. l, Myofibroblasts identified by αSMA immunostaining (red), co-stained with DAPI (blue). Scale bars, 50 μm. m, Percentage of αSMA+ cells. n, qPCR mRNA expression of Acta2 and Postn. n = 3 biological replicates. All data are depicted as mean ± s.e.m. Two-way ANOVA with Tukey honestly significant difference (HSD) for multiple comparisons. Veh, vehicle. Full-length western blots are available as source data. Source data
Fig. 2
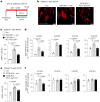
Fig. 2. ACLY inhibition reverts the myofibroblast phenotype, even with continuous TGFβ stimulation.
a, Timeline of reversion treatments with 4 μM BMS-303141 (ACLYi) in vitro on adult mouse CFs. Con, control. b, Myofibroblasts identified by αSMA by immunostaining (red), co-stained with DAPI (blue). Scale bars, 50 μm. c, Percentage of αSMA+ cells. d, qPCR mRNA expression of Acta2, Postn, Col1a1 and Col3a1. e, Immunoblots of COL1A1 and αTubulin (load con). f, COL1A1 protein expression normalized to αTubulin. n = 3 biological replicates. All data are depicted as mean ± s.e.m. One-way ANOVA with Dunnett’s HSD. Full-length western blots are available as source data. Source data
Fig. 3
Fig. 3. Acly deletion in cardiac activated myofibroblasts preserves cardiac function and reduces interstitial fibrosis.
a, Tamoxifen-inducible, Cre-recombinase-mediated gene knockout of Acly and expression of R26-tdT in activated fibroblasts. b, Mice subjected to TAC at 0 week and started on tamoxifen chow to induce Cre-recombinase expression in activated CFs. Echocardiograms (Echo) performed every 4 weeks are indicated by arrows. Take-downs were performed at 8 weeks for interstitial fibrosis and gravimetrics. c, Western blot of ACLY knockout in Aclyfl/fl, PostniCre, R26-tdT CFs. d, Peak aortic pressure gradients from PostniCre, R26-tdT mice and Aclyfl/fl, PostniCre, R26-tdT mice that underwent TAC. Unpaired two-sided t-test. PostniCre, R26-tdT + TAC = 9 mice; Aclyfl/fl, PostniCre, R26-tdT + TAC = 8 mice. e, Echocardiographic data of mice followed 8 weeks after TAC. Long-axis, B-mode images. EF, ejection fraction; LVESV, LV end-systolic volume; LVEDV, LV end-diastolic volume. Two-way ANOVA with Tukey HSD. Comparisons between PostniCre, R26-tdT mice and Aclyfl/fl, PostniCre, R26-tdT mice at the same timepoint. Comparisons between different timepoints of the same genotype. PostniCre, R26-tdT + TAC = 10 mice at 0 week and 9 mice at 4 weeks and 8 weeks; Aclyfl/fl, PostniCre, R26-tdT + TAC = 10 mice at 0 week and 8 mice at 4 weeks and 8 weeks. f, B-mode speckle tracking calculations of LV strain rates at baseline (Base) and 8 weeks after TAC. Two-way ANOVA with Tukey HSD. PostniCre, R26-tdT + TAC = 10 mice at baseline and 9 mice at 8 weeks; Aclyfl/fl, PostniCre, R26-tdT + TAC = 10 mice at 0 week and 8 mice at 8 weeks. g, Picrosirius red staining of matrix protein in 10 μm LV sections. Scale bars, 200 μm. h, Percentage of the picrosirius red (PSR) stain over the total area. Outliers were identified by Grubbs test with an alpha of 0.05 and indicated with ‘×’ in the graph. Two-way ANOVA with Tukey HSD. i, Gravimetric data from mice at 8 weeks after TAC. HW, heart weight; TL, tibia length. Two-way ANOVA with Tukey HSD. For h and i, PostniCre, R26-tdT + sham = 7 mice; Aclyfl/fl, PostniCre, R26-tdT + sham = 5 mice; PostniCre, R26-tdT + TAC = 8 mice; and Aclyfl/fl, PostniCre, R26-tdT + TAC = 9 mice. All data are depicted as mean ± s.e.m. Full-length western blots are available as source data. Source data
Fig. 4
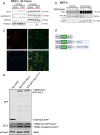
Fig. 4. Nuclear ACLY activity is essential to TGFβ-dependent myofibroblast activation.
a, Nuclear fractionation of immortalized CFs stimulated with TGFβ for 12 h and 24 h. Immunoblot for ACLY, histone deacetylase 1 (HDAC1) as the nuclear loading control, and lactate dehydrogenase A (LDHA) as the non-nuclear loading control. b, Nuclear ACLY protein expression normalized to HDAC1. One-way ANOVA with Dunnett’s HSD with 0 h TGFβ as the control, n = 3 biological replicates. c, MEFs transfected with NLS–GFP control, NLS–GFP–ACLY and NLS–GFP–ACLYH760A (all green) treated with and without TGFβ. Myofibroblasts identified by αSMA immunostaining (red), co-stained with DAPI (blue). Scale bars, 50 μm. d, Percentage of αSMA+ cells among GFP+ cells. All data are depicted as mean ± s.e.m. Two-way ANOVA with Tukey’s HSD. n = 5 biological replicates. Full-length western blots are available as source data. Source data
Fig. 5
Fig. 5. H3K27ac at fibrotic gene program loci requires ACLY activity.
a, ChIP–qPCR with H3K27ac antibody (ab4729) regulatory regions of Acta2 and Postn. Normalized to Ct values of rabbit IgG. One-way ANOVA with Dunnett’s HSD with TGFβ DMSO as positive control, n = 3 biological replicates. Data are depicted as mean ± s.e.m. b, Principal component analysis showing two principal components (PC1 and PC2) for H3K27ac-occupied regions for control (con; n = 4), con + ACLYi (n = 4), TGFβ + veh (n = 4) and TGFβ + ACLYi (n = 3). Cohorts are color coded, and each sample is represented by an individual point. The open circle represents a sample removed from downstream analysis. c, CUT&RUN-seq H3K27ac MA plots comparing TGFβ + veh versus con and TGFβ + ACLY versus con. Pink dots indicate regions with significant change in occupancy (FDR < 0.05). d, Venn diagram of H3K27ac-occupied regions increased in TGFβ versus con (orange) and regions increased in TGFβ + ACLYi versus con (green). The 1,829 regions that were increased only between TGFβ and con were examined for further study. e, Genome browser viewing tracks of ACLYi-sensitive regions outlined by dashed lines. Representative genes thrombospondin 1 (Thbs1) and hexokinase 2 (Hk2). f, DAVID gene ontology enrichment analysis of the 253 genes corresponding to the 1,829 ACLYi-sensitive regions, representing cellular components. The bottom x-axis represents the fold enrichment of genes in red bars of interest over a mouse genome background. The numbers in parentheses are the number of genes aligned to the GO term. The top x-axis represents −log10(FDR) by dot plot of genes of interest over a mouse genome background. g, DAVID gene ontology enrichment analysis of the 253 genes corresponding to the 1,826 ACLYi-sensitive regions representing biological processes. BMP, bone morphogenetic protein; VEGF, vascular endothelial growth factor. h, Co-immunoprecipitation of immortalized CF lysate treated with and without TGFβ for 12 h. Full-length western blots are available as source data. Source data
Fig. 6
Fig. 6. ACLY inhibition in human CFs from a patient with HF reverses myofibroblast fate and the fibrotic phenotype.
a, Timeline of reversion experiments, human CFs isolated from NICM patients were treated with or without 4 μM BMS-303141 (ACLYi). b, Imaging of hCFs showing an αSMA-striated myofibroblast structure from patient 1 with NICM. Blue, DAPI-stained nuclei; red, αSMA. Scale bars, 50 μm. c, Quantification of αSMA+ myofibroblasts in patient 1 with HF. d, Myofibroblast gene expression using qPCR in CFs of patient 1 with HF. e, Quantification of αSMA+ myofibroblasts in patient 2 with HF. f, Myofibroblast gene expression using qPCR in CFs of patient 2 with HF. n = 3 technical replicates per group for each patient. Bars represent means, and error bars represent the s.e.m. Analysis was done using one-way ANOVA with Dunnett’s HSD. Source data
Extended Data Fig. 1
Extended Data Fig. 1. ACLY inhibition after the onset of differentiation reverses myofibroblast phenotype.
(a) Timeline of reversion treatments with isolation of CFs at the 48 h timepoint before adding 4μM BMS-303141 (ACLYi) in vitro on adult mouse CFs. Control (Con). (b) Myofibroblasts identified by αSMA by immunostaining (red), co-stained with DAPI (blue). Scale bars = 50 mm. (c) Percent αSMA+ cells. n = 4 biological replicates. (d) qPCR mRNA expression of Alpha Actin 2 (Acta2), periostin (Postn), n = 3 biological replicates. All data depicted as mean ± SEM. One-way ANOVA with Dunnett’s HSD against TGFβ 96 h.
Extended Data Fig. 2
Extended Data Fig. 2. Aortic Pressure Gradients and B-mode speckle tracking on transgenic mice.
(a) Linear regression of peak aortic pressure gradients and %EF at 8 weeks from Aclyfl/fl, PostniCre, R26-tdT and PostniCre, R26-tdT mice undergoing TAC. (b) Echocardiography images trace the path (green lines) that individual speckles (yellow dots) were tracked during cycles of systole and diastole in Aclyfl/fl, PostniCre, R26-tdT and PostniCre, R26-tdT mice.
Extended Data Fig. 3
Extended Data Fig. 3. ACLY localizes to the nucleus with TGFβ stimulation.
(a) Nuclear fractionation of MEFs stimulated with TGFβ for 24 h. Immunoprobed for total ACLY, pSer455-ACLY (pACLY), fibrillarin as the nuclear loading control and αTubulin as the cytosolic control. n = 3 biological replicates per group. (b) Nuclear fractionation of MEFs stimulated with TGFβ over a time course of 0.5 h to 24 h. Immunoblot for total ACLY, Lamin B1 as the nuclear loading control, and fatty acid synthase (FASN) as the non-nuclear loading control. (c) Representative immunofluorescence images of tissue section from PostniCre, R26-tdT mouse that underwent TAC demonstrate that TdTomato+ activated fibroblasts (red) contain ACLY (green) in nuclei (DAPI, blue). Scale bar = 50 μm. (d) Fusion protein constructs utilized in Fig. 4c. (e) Western blot of MEFs transfected with plasmids containing fusion protein constructs. Panel d created with BioRender.com. Full length western blots in Source Data Fig. 6. Source data
Extended Data Fig. 4
Extended Data Fig. 4. mRNA expression of genes whose TGFβ-dependent H3K27ac-occupancy was blocked by ACLYi.
Mouse CFs co-treated with or without 10 ng/mL TGFβ and 4μM ACLY inhibitor (BMS 303141; ACLYi) for 48 h. Control (Con). Gene expression analysis using qPCR. Leukemia Inhibitory Factor (Lif), Lysyl Oxidase Like 1 (Loxl1), TNF Receptor Superfamily Member 12 A (Tnfrs12a), Serpin Family E Member 1 (Serpine1), Forkhead Box S1 (Foxs1), WW Domain Containing Transcription Regulator 1 (Wwtr1), cAMP Responsive Element Binding Protein 3 Like 1 (Creb3l1). n = 3 biological replicates. All bar graphs represented as mean with SEM for error bars. Two-way ANOVA with Tukey HSD for multiple comparisons.
Extended Data Fig. 5
Extended Data Fig. 5. TGFβ-induced H3K27ac-enriched CUT&RUN DNA sensitive to ACLY inhibition.
IGV tracks view with an y-axis of 0 to log10(4.70) with x-axis genomic coordinates provided above tracks. Control (Con), TGFβ+Vehicle (TGFβ+Veh). From left to right, Thrombospondin 1 (Thbs1), Cathespin S (Ctss), WW domain containing transcription regulator 1(Wwtr1), cAMP responsive element binding protein 3 like 1 (Creb3l1), LIM Domain-Containing Protein Ajuba (Ajuba), Hexokinase (Hk2). Dashed lines indicate which peaks/region are sensitive to ACLY inhibition.
Extended Data Fig. 6
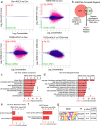
Extended Data Fig. 6. H3K27ac occupancy dependent on ACLY and TGFβ.
(a) CUT&RUN-Seq H3K27ac MA plots of all comparisons made between the four groups in Fig. 5b. Control (Con), Vehicle (Veh). Upper left compares ACLYi+Con vs Con, upper right compares TGFβ+Veh vs Con (reproduced from Fig. 5c), lower left compares TGFβ+ACLYi vs Con (reproduced from Fig. 5c), and lower right compares TGFβ+ACLYi vs TGFβ+Veh. Pink dots indicate regions with significant change in occupancy (FDR < 0.05). (b) Venn Diagram of H3K27ac occupied regions increased in TGFβ vs Con (red) and regions decreased in TGFβ+ACLYi vs TGFβ+Veh (green). The 99 regions which overlapped in these two comparisons were examined for further study. DAVID Gene Ontology enrichment analysis of the 89 genes corresponding to the 99 overlapping regions from (b), with (c) representing Cellular Components and (d) representing Biological Processes. Bottom x-axis represents the fold enrichment of genes in red bars of interest over mouse genome background. Parentheses give the number of genes aligned to the GO term. Top x-axis represents –log10(FDR) by dot plot of genes of interest over mouse genome background. DAVID gene ontology enrichment analysis of the 89 genes corresponding to the 99 overlapping regions from (b), with (e) representing Molecular Function and (f) representing KEGG Pathway analysis. Bottom x-axis represents the fold enrichment of genes in grey bars of interest over mouse genome background. Top x-axis represents –log10(FDR) by dot plot of genes of interest over mouse genome background. (g) Transcription factor binding sites enriched in the 99 overlapping regions from (b). p values calculated by Fisher exact test using HOMER.

Similar articles

Cited by

  • Metabolic control of collagen synthesis.
    Guillard J, Schwörer S. Guillard J, et al. Matrix Biol. 2024 Nov;133:43-56. doi: 10.1016/j.matbio.2024.07.003. Epub 2024 Jul 29. Matrix Biol. 2024. PMID: 39084474 Review.

References

    1. Sweeney, M., Corden, B. & Cook, S. A. Targeting cardiac fibrosis in heart failure with preserved ejection fraction: mirage or miracle? EMBO Mol. Med.12, e10865 (2020). 10.15252/emmm.201910865 - DOI - PMC - PubMed
    1. Diez, J. Mechanisms of cardiac fibrosis in hypertension. J. Clin. Hypertens.9, 546–550 (2007).10.1111/j.1524-6175.2007.06626.x - DOI - PMC - PubMed
    1. Humeres, C. & Frangogiannis, N. G. Fibroblasts in the infarcted, remodeling, and failing heart. JACC Basic Transl. Sci.4, 449–467 (2019). 10.1016/j.jacbts.2019.02.006 - DOI - PMC - PubMed
    1. Davis, J. & Molkentin, J. D. Myofibroblasts: trust your heart and let fate decide. J. Mol. Cell. Cardiol.70, 9–18 (2014). 10.1016/j.yjmcc.2013.10.019 - DOI - PMC - PubMed
    1. Chen, W. & Frangogiannis, N. G. Fibroblasts in post-infarction inflammation and cardiac repair. Biochim. Biophys. Acta1833, 945–953 (2013). 10.1016/j.bbamcr.2012.08.023 - DOI - PMC - PubMed

MeSH terms

LinkOut - more resources