. 2024 Jul 26;22(8):341.
doi: 10.3390/md22080341.

Protection of Tight Junctional Complexes between hCMEC/D3 Cells by Deep-Sea Fibrinolytic Compound FGFC1

Affiliations

Protection of Tight Junctional Complexes between hCMEC/D3 Cells by Deep-Sea Fibrinolytic Compound FGFC1

Xiaozhen Diao et al. Mar Drugs. .

Abstract

Tight junctional complexes (TJCs) between cerebral microvascular endothelial cells (CMECs) are essential parts of the blood-brain barrier (BBB), whose regulation closely correlates to the BBB's integrity and function. hCMEC/D3 is the typical cell line used to imitate and investigate the barrier function of the BBB via the construction of an in vitro model. This study aims to investigate the protective effect of the deep-sea-derived fibrinolytic compound FGFC1 against H2O2-induced dysfunction of TJCs and to elucidate the underlying mechanism. The barrier function was shown to decline following exposure to 1 mM H2O2 in an in vitro model of hCMEC/D3 cells, with a decreasing temperature-corrected transendothelial electrical resistance (tcTEER) value. The decrease in the tcTEER value was significantly inhibited by 80 or 100 µM FGFC1, which suggested it efficiently protected the barrier integrity, allowing it to maintain its function against the H2O2-induced dysfunction. According to immunofluorescence microscopy (IFM) and quantitative real-time polymerase chain reaction (qRT-PCR), compared to the H2O2-treated group, 80~100 µM FGFC1 enhanced the expression of claudin-5 (CLDN-5) and VE-cadherin (VE-cad). And this enhancement was indicated to be mainly achieved by both up-regulation of CLDN-5 and inhibition of the down-regulation by H2O2 of VE-cad at the transcriptional level. Supported by FGFC1's molecular docking to these proteins with reasonable binding energy, FGFC1 was proved to exert a positive effect on TJCs' barrier function in hCMEC/D3 cells via targeting CLDN-5 and VE-cad. This is the first report on the protection against H2O2-induced barrier dysfunction by FGFC1 in addition to its thrombolytic effect. With CLDN-5 and VE-cad as the potential target proteins of FGFC1, this study provides evidence at the cellular and molecular levels for FGFC1's reducing the risk of bleeding transformation following its application in thrombolytic therapy for cerebral thrombosis.

Keywords: FGFC1; blood–brain barrier; deep-sea fibrinolytic compounds; thrombolytic therapy; tight junctional complexes.


Conflict of interest statement

The authors declare no conflicts of interest.

Figures

Figure 1
Figure 1
The construction of the hCMEC/D3-based in vitro barrier model confirmed by TEER assay. (a) hCMEC/D3 cells were reseeded on the PET membrane of the hanging inserts in 24-well microplates and the barrier function was measured by the probe of a Millicell ERS-2 system; (b) hCMEC/D3 cells successfully formed a monolayer from 6 to 8 days after the reseeding, when the tcTEER values of the model became stable around 210–265 Ω/cm2 (310.15 K). Relative tcTEER values are means ± SD, n = 6.
Figure 2
Figure 2
The H2O2-induced barrier dysfunction by TEER assay in hCMEC/D3 cells. (a) hCMEC/D3 cells treated with solutions with different concentrations of H2O2 were investigated by CCK-8; (b) the in vitro model of hCMEC/D3 was exposed to 3.5 h incubation with different concentration H2O2 solutions. Each cell viability or tcTEER value is indicated as mean ± SD, n = 6. Asterisks indicate a significant difference among solutions with various concentrations of H2O2 (** p < 0.025, *** p < 0.01), as determined by the Kruskal–Wallis test.
Figure 3
Figure 3
The protection of TJCs in hCMEC/D3 cells from barrier dysfunction (red) by FGFC1 at various concentrations (green series). (a) The maintenance of relative tcTEER values by FGFC1 solutions (FS_55, 100) against 1 mM H2O2 treatment (NC) or not (blank). (b,c) The relationship between relative tcTEER values and the concentration of FGFC1 solution (FS_25, 55, 80, 100) against 1 mM H2O2 treatment (NC). Monolayers constructed by hCMEC/D3 cells were pretreated with or without (NC) different concentrations (25, 55, 80, and 100 µM) of the FGFC1 solution for 2 h, followed by 1 mM H2O2 treatment for 4 h or not (blank). Relative tcTEER values are means ± SD, n = 6. Asterisks indicate a significant difference compared to blank (** p < 0.005), determined by the Mann–Whitney U test, or among various concentrations of the FGFC1 solutions (* p < 0.05), determined by the Kruskal–Wallis test.
Figure 4
Figure 4
The protection by FGFC1 of the expression of TJC proteins including CLDN-5, OCLN, ZO-1, and VE-cad. Monolayers constructed by hCMEC/D3 cells were pretreated with different concentrations of the FGFC1 solution (80 and 100 µM) or without (NC) for 2 h, followed by 1 mM H2O2 treatment or not (blank) for 4 h. Images were observed by fluorescence microscopy. Each image is representative of 3 similar experiments. The scale bar is 200 µm.
Figure 5
Figure 5
The enhancements in TJC protein expression in barrier dysfunction (red) caused by various concentrations of FGFC1 (green series). Four immunostained photomicrographs of CLDN-5 (a), OCLN (b), ZO-1 (c), and VE-cad (d) were separately randomly selected in each group and semi-quantitatively analyzed by ImageJ. Immunostained mean value is calculated by the mean integral optical density of each group relative to blank. Bars are means ± SD, n = 4. Asterisks indicate a significant difference between various concentrations of FGFC1 solutions (*** p < 0.01, **** p < 0.005), as determined by the Kruskal–Wallis test.
Figure 6
Figure 6
The influence of various concentrations of FGFC1 solution on the expression of TJC proteins (CLDN-5 (a), OCLN (b), ZO-1 (c), and VE-cad (d)) at the transcriptional level. Monolayers constructed by hCMEC/D3 cells were pretreated with various concentrations of FGFC1 solution (55, 80, and 100 µM) or without (NC) for 2 h, followed by 1 mM H2O2 treatment or not for 4 h. The total RNA was extracted from each group pretreated with the FGFC1 solution (2 h) at 2.0, 3.0, 3.5 h incubation time with H2O2 to investigate the mRNA level of each TJC protein. The mRNA expression relative to the blank is shown as mean ± SD, n = 6. Asterisks indicate a significant difference among various concentrations of FGFC1 solution (* p < 0.05, ** p < 0.025), as determined by the Kruskal–Wallis test.
Figure 7
Figure 7
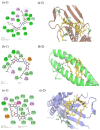
Schematic representation of the interaction between FGFC1 and the optimal conformation of CLDN-5, OCLN, and VE-cad. (a-1c-1) The 3D model of FGFC1 docking CLDN-5, OCLN, and VE-cad (yellow: FGFC1, brown: CLDN-5, green: OCLN, purple: VE-cad). (a-2c-2) Planar model of the binding sites of CLDN-5, OCLN, and VE-cad by FGFC1.
Figure 8
Figure 8
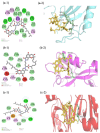
Schematic representation of the interaction between FGFC1 and the optimal conformation of ZO-1. (a-1c-1) The 3D model of FGFC1 docking three domains of ZO-1 (yellow: FGFC1, blue: PDZ1, pink: PDZ2, red: PDZ3). (a-2c-2) Planar model of the binding sites of PDZ1/2/3 of ZO-1 by FGFC1.
Figure 9
Figure 9
The optimization of the concentrations of FGFC1 solutions. (a) hCMEC/D3 cells pretreated with different concentrations (25, 55, 80, 100 µM) of FGFC1 (FS_25/55/80/100) followed by 2 and 4 h incubation with H2O2 were investigated by CCK-8. Each cell viability value is indicated as mean ± SD, n = 6. (b) The barriers constructed by hCMEC/D3 cells treated with various concentrations of FGFC1 solution, whose morphology characteristics were observed under the microscopy. Red arrows refer to the enlarged interval induced by the high concentrations of FGFC1 solutions. Each image is representative of 3 similar experiments. The scale bar is 100 µm.

Similar articles

Cited by

References

    1. Al-Rihani S.B., Batarseh Y.S., Kaddoumi A. The Blood-Brain Barrier in Health and Disease. Int. J. Mol. Sci. 2023;24:9261. doi: 10.3390/ijms24119261. - DOI - PMC - PubMed
    1. Kadry H., Noorani B., Cucullo L. A blood-brain barrier overview on structure, function, impairment, and biomarkers of integrity. Fluids Barriers CNS. 2020;17:69–93. doi: 10.1186/s12987-020-00230-3. - DOI - PMC - PubMed
    1. Profaci C.P., Munji R.N., Pulido R.S., Daneman R. The blood-brain barrier in health and disease: Important unanswered questions. J. Exp. Med. 2020;217:e20190062. doi: 10.1084/jem.20190062. - DOI - PMC - PubMed
    1. Lochhead J.J., Yang J., Ronaldson P.T., Davis T.P. Structure, Function, and Regulation of the Blood-Brain Barrier Tight Junction in Central Nervous System Disorders. Front. Physiol. 2020;11:914–931. doi: 10.3389/fphys.2020.00914. - DOI - PMC - PubMed
    1. Abbott N.J., Patabendige A.A., Dolman D.E., Yusof S.R., Begley D.J. Structure and function of the blood-brain barrier. Neurobiol. Dis. 2010;37:13–25. doi: 10.1016/j.nbd.2009.07.030. - DOI - PubMed

MeSH terms

LinkOut - more resources