. 2024 Sep 17;98(9):e0057424.
doi: 10.1128/jvi.00574-24. Epub 2024 Aug 28.

Ipsilateral or contralateral boosting of mice with mRNA vaccines confers equivalent immunity and protection against a SARS-CoV-2 Omicron strain

Affiliations

Ipsilateral or contralateral boosting of mice with mRNA vaccines confers equivalent immunity and protection against a SARS-CoV-2 Omicron strain

Baoling Ying et al. J Virol. .

Abstract

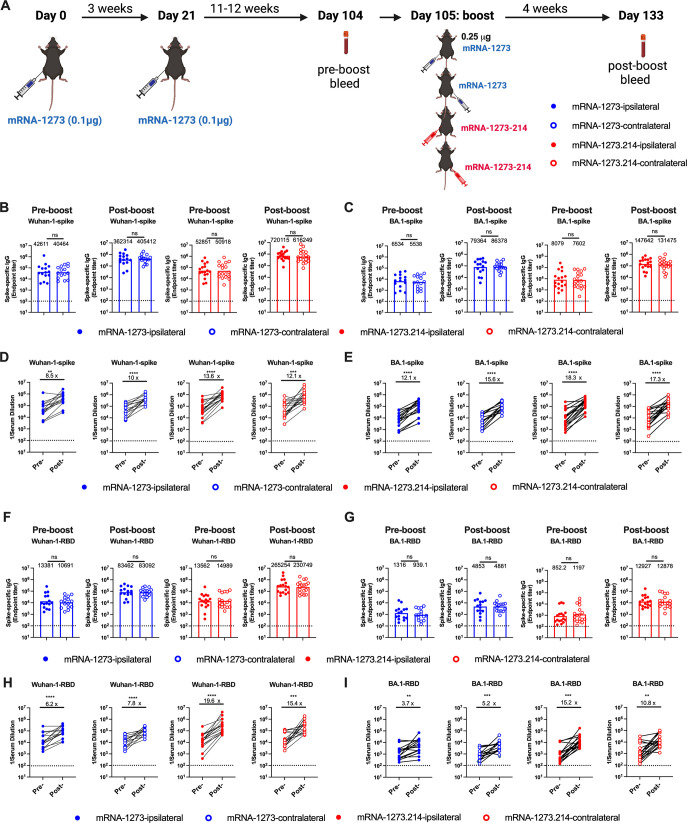
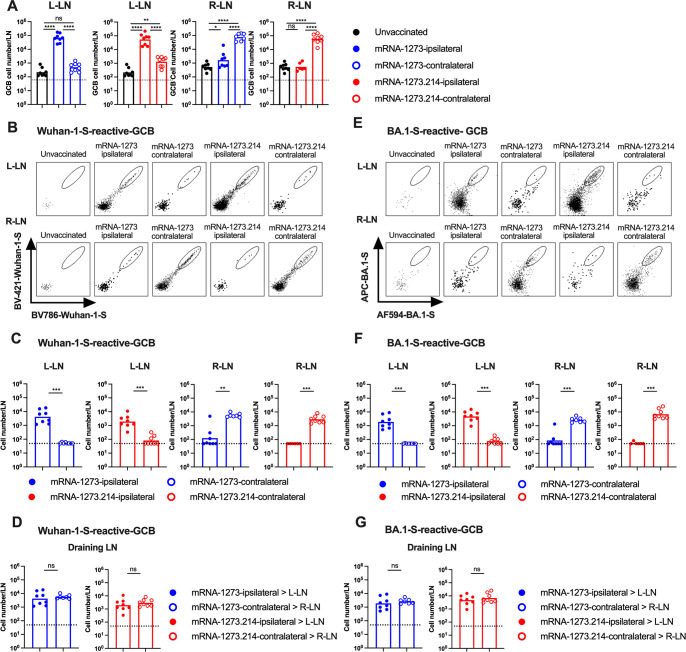
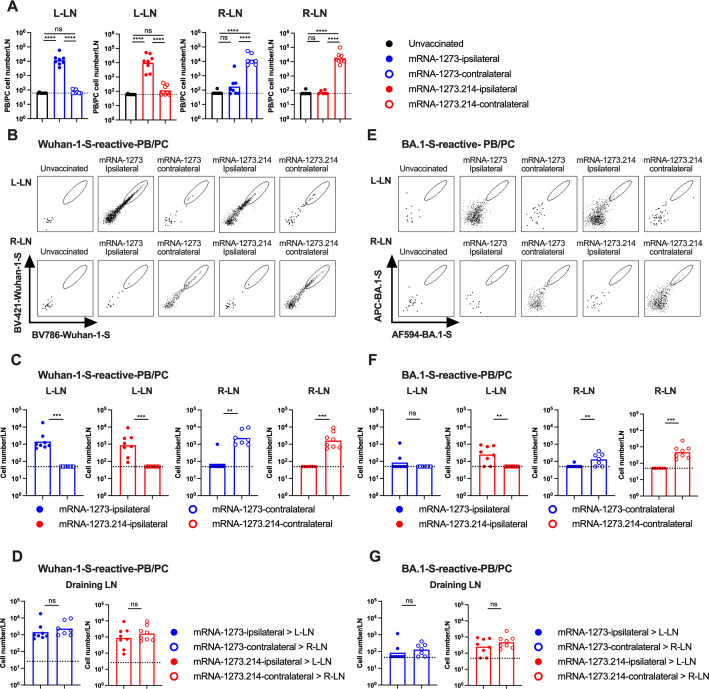
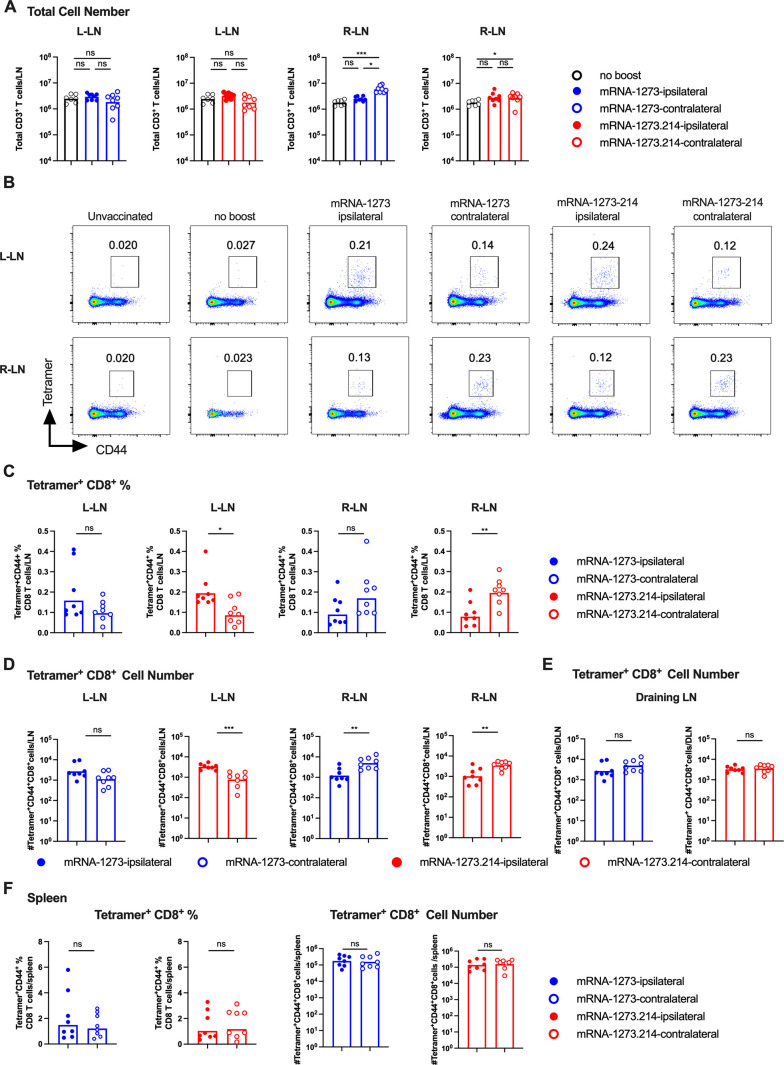
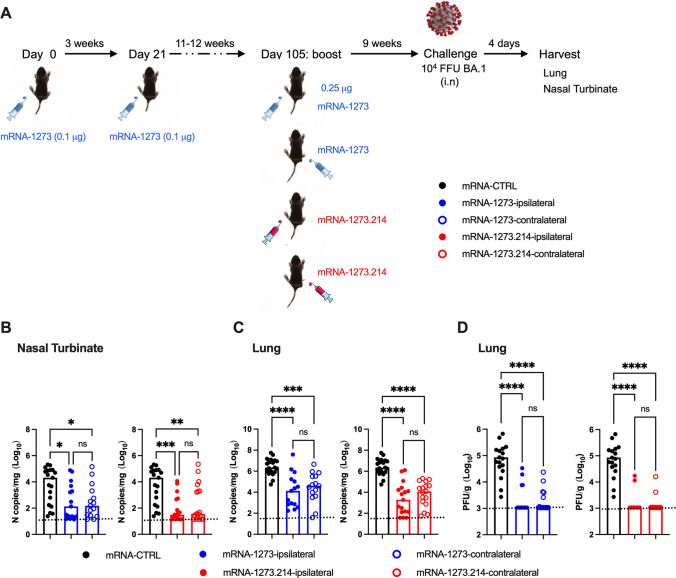
Boosting with mRNA vaccines encoding variant-matched spike proteins has been implemented to mitigate their reduced efficacy against emerging SARS-CoV-2 variants. Nonetheless, in humans, it remains unclear whether boosting in the ipsilateral or contralateral arm with respect to the priming doses impacts immunity and protection. Here, we boosted K18-hACE2 mice with either monovalent mRNA-1273 (Wuhan-1 spike) or bivalent mRNA-1273.214 (Wuhan-1 + BA.1 spike) vaccine in the ipsilateral or contralateral leg after a two-dose priming series with mRNA-1273. Boosting in the ipsilateral or contralateral leg elicited equivalent levels of serum IgG and neutralizing antibody responses against Wuhan-1 and BA.1. While contralateral boosting with mRNA vaccines resulted in the expansion of spike-specific B and T cells beyond the ipsilateral draining lymph node (DLN) to the contralateral DLN, administration of a third mRNA vaccine dose at either site resulted in similar levels of antigen-specific germinal center B cells, plasmablasts/plasma cells, T follicular helper cells, and CD8+ T cells in the DLNs and the spleen. Furthermore, ipsilateral and contralateral boosting with mRNA-1273 or mRNA-1273.214 vaccines conferred similar homologous or heterologous immune protection against SARS-CoV-2 BA.1 virus challenge with equivalent reductions in viral RNA and infectious virus in the nasal turbinates and lungs. Collectively, our data show limited differences in B and T cell immune responses after ipsilateral and contralateral site boosting by mRNA vaccines that do not substantively impact protection against an Omicron strain.IMPORTANCESequential boosting with mRNA vaccines has been an effective strategy to overcome waning immunity and neutralization escape by emerging SARS-CoV-2 variants. However, it remains unclear how the site of boosting relative to the primary vaccination series shapes optimal immune responses or breadth of protection against variants. In K18-hACE2 transgenic mice, we observed that intramuscular boosting with historical monovalent or variant-matched bivalent vaccines in the ipsilateral or contralateral limb elicited comparable levels of serum spike-specific antibody and antigen-specific B and T cell responses. Moreover, boosting on either side conferred equivalent protection against a SARS-CoV-2 Omicron challenge strain. Our data in mice suggest that the site of intramuscular boosting with an mRNA vaccine does not substantially impact immunity or protection against SARS-CoV-2 infection.

Keywords: B-cell responses; SARS-CoV-2; T cell responses; immunity; infection; vaccine.


Conflict of interest statement

M.S.D. is a consultant or advisor for Inbios, Vir Biotechnology, IntegerBio, Moderna, Merck, GlaxoSmithKline, and Marshall, Gerstein and Borun. The Diamond laboratory has received unrelated funding support in sponsored research agreements from Vir Biotechnology, Emergent BioSolutions, and IntegerBio. S.M.E. and D.K.E. are employees and shareholders in Moderna Inc. All other authors declare no conflicts of interest.

Figures

Fig 1
Fig 1
Serum IgG responses in K18-hACE2 mice following boosting. Seven- to 9-week-old female K18-hACE2 mice were immunized with a primary two-dose vaccination series spaced 3 weeks apart in the left hind leg with 0.1 μg of mRNA-1273. Animals were boosted 11–12 weeks later in the left (ipsilateral) or right (contralateral) leg with 0.25 μg of mRNA-1273 or bivalent mRNA-1273.214. One day before (pre-boost) or 4 weeks after boost (post-boost), serum was collected and IgG titers were determined by ELISA. (A) Scheme of immunizations and blood collection. (B and C) Serum IgG responses against the spike of Wuhan-1(B) or BA.1 (C). (D and E) Paired analysis of serum IgG titers of pre- and post-boost against WA1/2020 D614G (D) and BA.1 (E). (F and G) Serum IgG responses against RBD domain of Wuhan-1 (F) or BA.1 (G). (H and I) Paired analysis of serum IgG titers of pre- and post-boost against WA1/2020 D614G (H) and BA.1 (I) [n = 15–18, two experiments, column heights indicate geometric mean titers (GMT), and dotted lines show the limit of detection (LOD)]. GMTs or fold-changes are indicated above the corresponding graphs. Statistical analyses: B, C, F, and G. Mann-Whitney test: D, E, H, and I. Wilcoxon matched signed-rank test. *P < 0.05; **P < 0.01, P < 0.001, and P < 0.0001.
Fig 2
Fig 2
Serum neutralizing antibody responses against WA1/2020 D614G and BA.1. One day before (pre-boost) or 4 weeks after (post-boost) ipsilateral or contralateral hind leg boosting with mRNA-1273 or mRNA-1273.214, serum neutralizing antibody was determined by FRNT against the indicated authentic SARS-CoV-2 strains. (A) WA1/2020 D614G. (B) BA.1 (n = 15–18, two experiments, boxes illustrate GMTs, and dotted lines show the LOD). (C and D) Paired analysis of serum neutralizing titers of pre- and post-boost against WA1/2020 D614G (C) and BA.1 (D) (n = 15–18, two experiments, column heights indicate GMTs, and dotted lines show the LOD). GMTs or fold-changes are indicated above the corresponding graphs. Statistical analyses: (A and B), Mann-Whitney test; (C and D), Wilcoxon matched-pairs signed-rank test. ns, not significant; *P < 0.05; **P < 0.01, P < 0.001, and P < 0.0001.
Fig 3
Fig 3
Germinal center B cell responses in the lymph nodes following boosting with mRNA-1273 or mRNA-1273.214. Seven- to 9-week-old female K18-hACE2 mice were immunized with a primary two-dose vaccination series spaced 3 weeks apart in the left hind leg with mRNA-1273. Animals then were boosted 11–12 weeks later in the left (ipsilateral) or right (contralateral) leg with 1 µg of mRNA-1273 or mRNA-1273.214. Seven days after boosting, inguinal LNs from the left and right sides were analyzed for GCB responses by flow cytometry. (A) Quantification of total number of CD19+IgDlowGL7+Fas+ GCBs in respective LNs. Note that the number of GCBs in the LNs on the respective side (L-LN or R-LN) from unvaccinated mice are shown in each graph with the different vaccines (mRNA-1273 or mRNA1273.214) for comparison purposes. (B) Representative flow cytometry scatter plots of Wuhan-1 spike-reactive GCBs. (C) Total numbers of Wuhan-1 spike-reactive GCBs in the respective LNs. (D) Comparison of numbers of Wuhan-1 spike-reactive GCBs in the DLNs. (E) Representative flow cytometry scatter plots of BA.1 spike-reactive GCBs. (F) Total number of BA.1 spike-reactive GCBs in respective LNs. (G) Comparison of numbers of BA.1 spike-reactive GCBs in the DLNs. Data are from two experiments (n = 7–8, each data point represents an individual mouse, column heights indicate geometric mean values, and dotted lines show the LOD). Data in D and G correspond to data in C and F, respectively, and are replotted for direct statistical comparison. Statistical analyses: A; one-way analysis of variance (ANOVA) with Tukey’s post-test: C, D, F, and G; unpaired two-tailed Mann-Whitney test: ns, not significant; *P < 0.05, P < 0.01, P < 0.001, and P < 0.0001.
Fig 4
Fig 4
Plasmablast and plasma cell responses in the lymph nodes following boosting with mRNA-1273 or mRNA-1273.214. K18-hACE2 mice were immunized and boosted as described in Fig. 3. Seven days after boosting, inguinal LNs from the left and right sides were analyzed for PB/PC responses by flow cytometry. (A) Total number CD19+IgDlowCD138+TACI+ PBs/PCs. Note that the number of PB/PCs in the LNs on the respective side (L-LN or R-LN) from unvaccinated mice are shown in each graph with the different vaccines (mRNA-1273 or mRNA-1273.214) for comparison purposes. (B) Representative flow cytometry scatter plots of Wuhan-1 spike-reactive PBs/PCs. (C) Total number of Wuhan-1 spike-reactive PBs/PCs in respective LNs. (D) Comparison of numbers of Wuhan-1 spike-reactive PBs/PCs in the DLNs. (E) Representative flow cytometry scatter plots of BA.1 spike reactive PBs/PCs. (F) Total number of BA.1 spike reactive PB/PC cells in respective LNs. (G) Comparison of numbers of BA.1 spike reactive PBs/PCs in the DLNs. Data are from two independent experiments (n = 7–8, each data point represents an individual mouse, column heights indicate geometric mean values, and dotted lines show the LOD). Data in D and G correspond to data in C and F, respectively, and are replotted for direct statistical comparison. Statistical analyses: A; one-way ANOVA with Tukey’s post-test: C, D, F, and G; unpaired two-tailed Mann-Whitney test: ns, not significant; *P < 0.05, P < 0.01, P < 0.001, and P < 0.0001.
Fig 5
Fig 5
CD8+ T cell responses in the lymph nodes and spleen following boosting with mRNA-1273 or mRNA-1273.214. Seven- to 9-week-old female K18-hACE2 mice were immunized with a primary two-dose vaccination series spaced 3 weeks apart in the left hind leg with mRNA-1273. Animals then were boosted 11–12 weeks later in the left (ipsilateral) or right (contralateral) leg with 1 µg of mRNA-1273 or mRNA-1273.214. Seven days after boosting, inguinal LNs from the left and right side as well as spleen were analyzed for CD8+ T cell responses by flow cytometry. (A) Quantification of total number of CD3+ T cells in respective LNs. Note that the number of CD3+ T cells in the LNs on the respective side (L-LN or R-LN) from unvaccinated mice are shown in each graph with the different vaccines (mRNA-1273 or mRNA-1273.214) for comparison purposes. (B) Representative flow cytometry scatter plots of spike-specific tetramer+CD44+CD8+ T cells in respective LNs. (C and D) Spike-specific tetramer+CD44+CD8+ T cells in respective LNs: C, frequency, D, total cell number. (E) Comparison of numbers of spike-specific tetramer+CD44+CD8+ T cells in the DLNs. (F) Frequency and total cell number of spike-specific tetramer+CD44+CD8+ T cells in the spleen. Data are from two experiments (n = 7–8, each data point represents an individual mouse, and column heights indicate geometric mean values). Data in E correspond to data in D and is replotted for direct statistical comparison. Statistical analyses: A; one-way ANOVA with Tukey’s post-test: C, D, E, and F; unpaired two-tailed Mann-Whitney test: ns, not significant; *P < 0.05, P < 0.01, and P < 0.001.
Fig 6
Fig 6
Protection against BA.1 infection in K18-hACE2 mice following boosting with mRNA-1273 or mRNA-1273.214. (A) Scheme of immunizations and virus challenge. Seven- to 9-week-old female K18-hACE2 mice were immunized with a primary two-dose vaccination series spaced 3 weeks apart in the left hind leg with 0.1 μg of mRNA-1273. Animals were boosted 11–12 weeks later in the left (ipsilateral) or right (contralateral) leg with 0.25 μg of mRNA-1273 or bivalent mRNA-1273.214. Mice immunized with mRNA-control (left hind leg) were used as a negative control group. Nine weeks after boosting, mice were challenged via an intranasal route with 104 FFUs of SARS-CoV-2 BA.1. Viral RNA levels were determined at 4 dpi in the nasal turbinates (B) and lungs (C). (D) Infectious virus in the lungs. Data are from two independent experiments (n = 15–18, each data point represents an individual mouse, and column heights indicate median values). Note that the viral yield in the nasal turbinates or lungs (B–D) after immunization with mRNA-control is shown in each graph with the different vaccines (mRNA-1273 or mRNA1273.214) for comparison purposes. Statistical analyses: one-way ANOVA with Tukey’s post-test: ns, not significant; *P < 0.05, P < 0.01, P < 0.001, and P < 0.0001.

Similar articles

References

    1. Watson OJ, Barnsley G, Toor J, Hogan AB, Winskill P, Ghani AC. 2022. Global impact of the first year of COVID-19 vaccination: a mathematical modelling study. Lancet Infect Dis 22:1293–1302. doi:10.1016/S1473-3099(22)00320-6 - DOI - PMC - PubMed
    1. Cele S, Jackson L, Khoury DS, Khan K, Moyo-Gwete T, Tegally H, San JE, Cromer D, Scheepers C, Amoako DG, et al. . 2022. Omicron extensively but incompletely escapes Pfizer BNT162b2 neutralization. Nature New Biol 602:654–656. doi:10.1038/s41586-021-04387-1 - DOI - PMC - PubMed
    1. Liu L, Iketani S, Guo Y, Chan JF-W, Wang M, Liu L, Luo Y, Chu H, Huang Y, Nair MS, Yu J, Chik KK-H, Yuen TT-T, Yoon C, To KK-W, Chen H, Yin MT, Sobieszczyk ME, Huang Y, Wang HH, Sheng Z, Yuen K-Y, Ho DD. 2022. Striking antibody evasion manifested by the Omicron variant of SARS-CoV-2. Nature New Biol 602:676–681. doi:10.1038/s41586-021-04388-0 - DOI - PubMed
    1. Viana R, Moyo S, Amoako DG, Tegally H, Scheepers C, Althaus CL, Anyaneji UJ, Bester PA, Boni MF, Chand M, et al. . 2022. Rapid epidemic expansion of the SARS-CoV-2 Omicron variant in southern Africa. Nature New Biol 603:679–686. doi:10.1038/s41586-022-04411-y - DOI - PMC - PubMed
    1. Lau JJ, Cheng SMS, Leung K, Lee CK, Hachim A, Tsang LCH, Yam KWH, Chaothai S, Kwan KKH, Chai ZYH, Lo THK, Mori M, Wu C, Valkenburg SA, Amarasinghe GK, Lau EHY, Hui DSC, Leung GM, Peiris M, Wu JT. 2023. Real-world COVID-19 vaccine effectiveness against the Omicron BA.2 variant in a SARS-CoV-2 infection-naive population. Nat Med 29:348–357. doi:10.1038/s41591-023-02219-5 - DOI - PMC - PubMed

MeSH terms

Supplementary concepts

LinkOut - more resources