. 2024 Aug 12:15:1433832.
doi: 10.3389/fimmu.2024.1433832. eCollection 2024.

Molecular screening of transitional B cells as a prognostic marker of improved graft outcome and reduced rejection risk in kidney transplant

Affiliations

Molecular screening of transitional B cells as a prognostic marker of improved graft outcome and reduced rejection risk in kidney transplant

Inés Perezpayá et al. Front Immunol. .

Abstract

Introduction: Understanding immune cell dynamics in kidney transplantation may provide insight into the mechanisms of rejection and improve patient management. B cells have gained interest with a special relevance of the "regulatory" subsets and their graft outcome prognostic value. In this study, we aimed to prove that the direct immunophenotyping and target gene expression analysis of kidney transplant patients' fresh whole blood will help to identify graft rejection risk and assist in the monitoring of kidney transplanted patients.

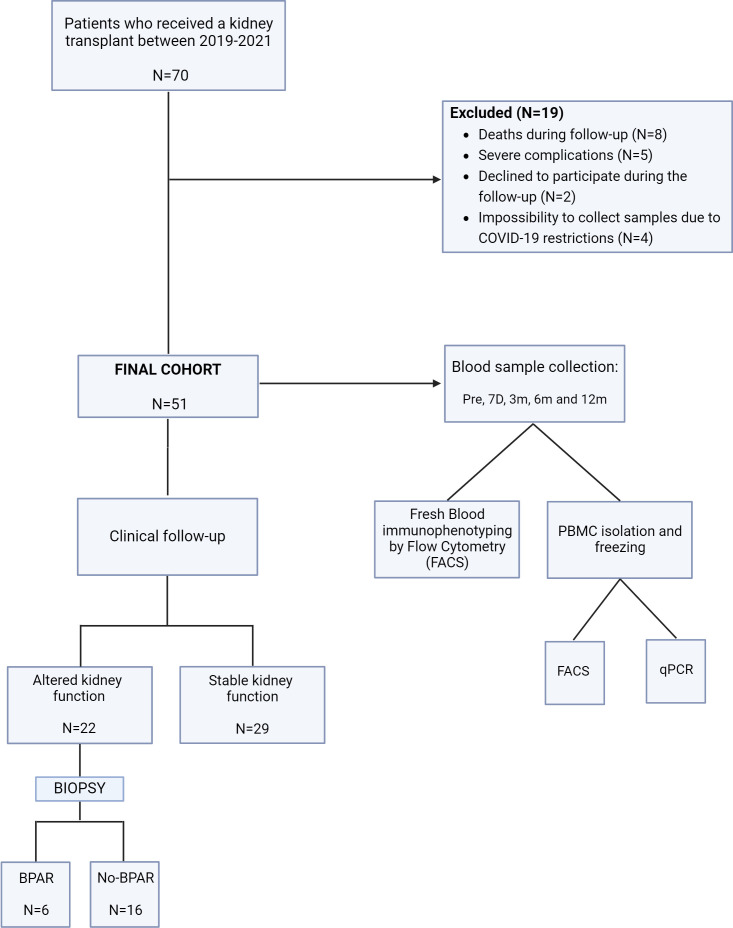
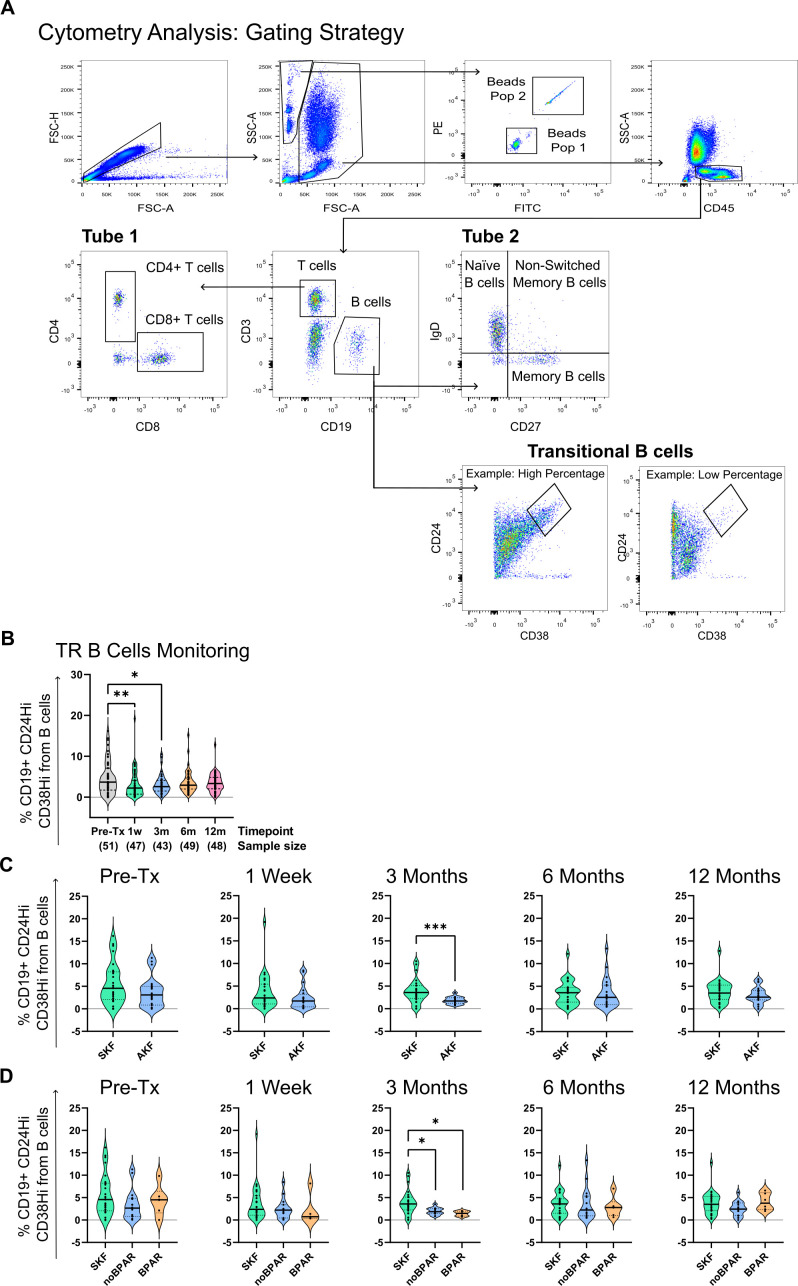
Methods: We employed flow cytometry and qPCR techniques to characterize B and T cell subsets within fresh whole blood samples, with particular emphasis on transitional B cells (TrB) identified as CD19+CD24hiCD38hi. TrB are a relevant population in the context of kidney transplantation and are closely associated with regulatory B cells (Bregs) in humans. Patients were monitored, tracking pertinent clinical parameters and kidney-related events, including alterations in graft function and episodes of biopsy proven rejection.

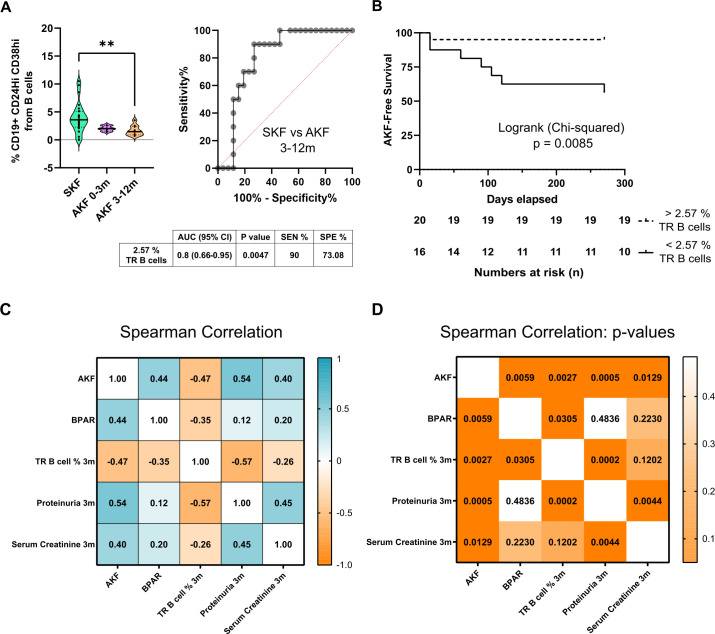
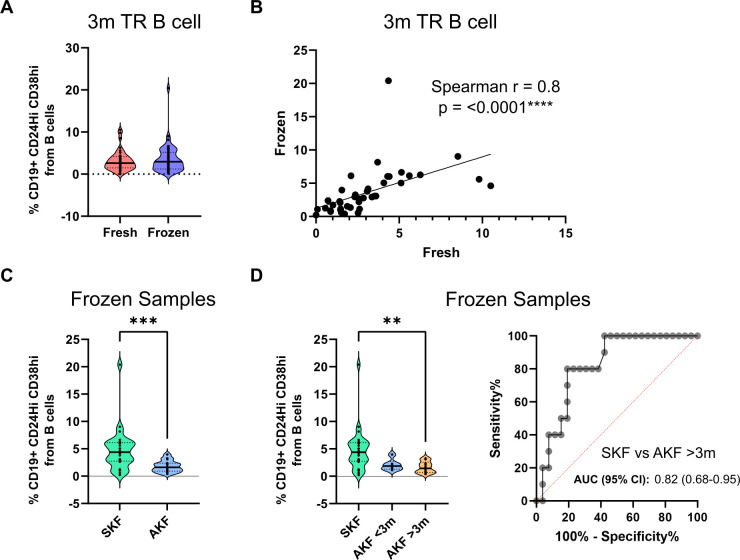
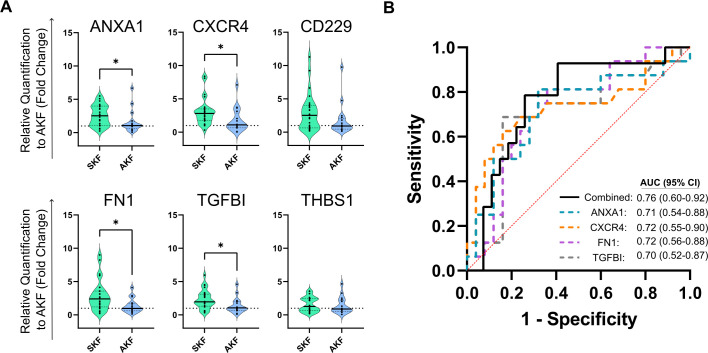
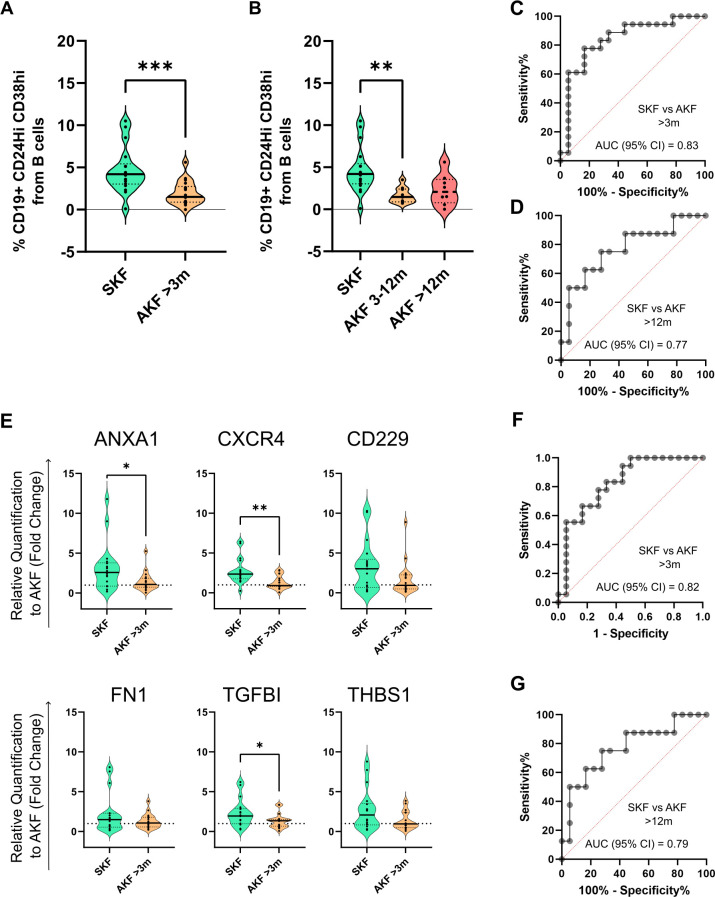
Results: Higher percentages of TrB cells at 3 months after transplantation were positively associated with better graft outcomes and lower biopsy-proven acute rejection risk. Furthermore, a novel panel of B cell regulatory associated genes was validated at 3 months post-transplantation by qPCR analysis of peripheral blood mononuclear cell (PBMC) mRNA, showing high predictive power of graft events and prognostic value.

Discussion: These findings suggest that monitoring TrB may provide interesting patient management information, improve transplant outcomes, and allow for personalized drug regimens to minimize clinical complications.

Keywords: Breg; acute graft rejection; flow cytometry; immunophenotyping; transitional B cells.


Conflict of interest statement

The authors declare that the research was conducted in the absence of any commercial or financial relationships that could be construed as a potential conflict of interest. The author MF declares that they were an editorial board member of Frontiers, at the time of submission. Thishad no impact on the peer review process and the final decision.

Figures

Figure 1
Figure 1
Schematic showing the study design, participants, and methods. Patients from the Germans Trias I Pujol hospital were enrolled in this study. BPAR, biopsy-proven acute rejection. no-BPAR, patients with altered kidney function but no diagnosis of acute rejection in biopsies; qPCR, quantitative polymerase chain reaction; Pre, prior to transplantation; 7D, seven days; 3/6/12m, 3/6/12 months.
Figure 2
Figure 2
Transitional B-cell (CD19+CD24hiCD38hi) percentages are reduced at 3 months post-transplantation in kidney transplanted patients with altered kidney function (AKF) while remain stable in patients with stable kidney function (SKF). (A) Cytometry gating strategy. First, singlets are gated by forward scatter (FSC-H vs. FSC-A). From singlets, alive cells and beads are gated separately. Beads are further divided into the two different populations of beads that compose the mix. Alive cells are further gated by CD45 expression. From CD45+, T (CD3+CD19-) and B cells (CD3-CD19+) are gated. T-cell CD4 and CD8 populations were analyzed in tube 1. In tube 2, from total B cells, we analyzed transitional B-cell populations (CD19+CD24hiCD38hi), memory (CD19+CD27+IgD-), and naïve B cells (CD19+CD27-IgD-). (B) Representation of the percentage of transitional B cells (TrB) from total B cells at all time points of study. Transitional B-cell percentages are reduced at 1 and 3 months. (C) Comparison of transitional B-cell percentages between SKF and AKF groups. (D) Comparison of transitional B-cell percentages between patients with SKF and AKF with diagnosis of biopsy-proven acute rejection (BPAR) or those who do not (noBPAR). There was a significant reduction at 3 months in patients from the SKF group compared to AKF. * p < 0.05, ** p < 0.01, *** p < 0.001.
Figure 3
Figure 3
Transitional B-cell relative counts at 3 months predict worse graft outcome for the first-year follow-up. (A) Comparison of transitional B-cell (TrB cells) percentages stratifying patients with AKF according to diagnosis of altered kidney function during the first 3 months after transplantation (AKF 0–3m) or after 3 months (AKF 3–12m). TrB shows significantly higher percentages in patients with stable kidney graft function (SKF) compared to patients with altered kidney function (AKF) after 3 months with high AUC values, sensitivity, and specificity by ROC curve analysis. The table under graphs shows relevant statistical results from ROC curve analysis. (B) Survival curves show how patients with lower Breg percentages (<2.57%) have a significant decrease of AKF-free survival. Cutoff value (2.57) was established according to ROC curve analysis from 4A. (C) Spearman correlation r values of AKF, BPAR, transitional B cells (TrB cells), proteinuria, and creatinine at 3 months and (D) Spearman correlation p-values show how all parameters tested correlate significantly to AKF, but only TrB cells correlate to BPAR. **p < 0.01.
Figure 4
Figure 4
Transitional B-cell percentages are comparable in fresh and frozen samples and maintain their discriminative potential in frozen samples. (A) Comparison of transitional B-cell (TrB cell) percentages in fresh and frozen samples analysis showing no significant differences (B) Spearman correlation analysis of TrB cells of fresh and frozen analysis showing a significant and highly correlated result. (C) TrB cell percentage comparison between patients with stable kidney function (SKF) and altered kidney function (AKF) in frozen samples shows significantly elevated percentages in the SKF group. (D) Comparison of TrB cell percentages between patients according to the time of AFK diagnosis shows a trend of lower TrB percentages in patients with diagnosis of AKF before the 3-month time point (AKF <3m) and a significant decrease in patients with diagnosis afterwards (AKF >3m). **p < 0.01, ***p < 0.001.
Figure 5
Figure 5
Transitional B cell-associated genes show a correlation at 3 months post-transplantation with altered kidney function (A) Violin plots show the relative expression to the altered kidney function (AKF) group mean value by the 2–ΔΔCT method of single genes in PBMCs. Four out of six genes show a significant decrease in patients with AKF compared to patients with stable function during the first-year post-transplantation (SKF). (B) ROC curve analysis of single genes (dotted colored lines) or the combination of them by multiple logistic regression (black line) show high discrimination potential of TrB cell-associated genes. *p < 0.05.
Figure 6
Figure 6
Transitional B-cell immunophenotyping and molecular analysis at 3 months post-transplantation maintain their discrimination potential beyond the 12-month time point (A) Violin plot shows the comparison of TrB cells between patients with stable kidney function (SKF) and patients with a diagnosis of altered kidney function (AKF) after the 3-month time point that were followed up until 5 years post-transplantation. (B) TrB cell percentage comparison between patients with AKF with diagnosis between 3 and 12 months (AKF 3–12m) and after the 12-month time point (AKF >12m). Results show a significant decrease in AKF 3–12m compared to SKF. (C) ROC curve analysis of TrB percentages between patients with SKF and AKF with diagnosis after 3 months. (D) ROC curve analysis of TrB cell percentages between patients with SKF and AKF with diagnosis after 12 months. (E) Violin plot shows the comparison of TrB cell-associated genes relative expression to the AKF group mean value by the 2–ΔΔCT method between patients with SKF and patients with a diagnosis of AKF after the 3-month time point that were followed up until 5 years post-transplantation. (F) ROC curve analysis of the combination of ANXA1, CXCR4, FN1 and TGFBI by multiple logistic regression between patients with SKF and AKF with diagnosis after 3 months. (G) ROC curve analysis on the comparison of the same genes in patients with SKF and AKF with diagnosis after 12 months. *p < 0.05, **p < 0.01, ***p < 0.001.

Similar articles

References

    1. Rosser EC, Mauri C. Regulatory B cells: origin, phenotype, and function. Immunity. (2015) 42:607–12. doi: 10.1016/j.immuni.2015.04.005 - DOI - PubMed
    1. Carreras-Planella L, Borràs FE, Franquesa M. Tolerance in kidney transplantation: what is on the B side? Mediators Inflammation. (2016) 2016:1–11. doi: 10.1155/2016/8491956 - DOI - PMC - PubMed
    1. Oleinika K, Mauri C, Salama AD. Effector and regulatory B cells in immune-mediated kidney disease. Nat Rev Nephrol. (2019) 15:11–26. doi: 10.1038/s41581-018-0074-7 - DOI - PubMed
    1. Chesneau M, Michel L, Dugast E, Chenouard A, Baron D, Pallier A, et al. . Tolerant kidney transplant patients produce B cells with regulatory properties. J Am Soc Nephrol. (2015) 26:2588–98. doi: 10.1681/ASN.2014040404 - DOI - PMC - PubMed
    1. Garcia SG, Sandoval-Hellín N, Franquesa M. Regulatory B cell therapy in kidney transplantation. Front Pharmacol. (2021) 12:791450. doi: 10.3389/fphar.2021.791450 - DOI - PMC - PubMed

Grants and funding

The author(s) declare financial support was received for the research, authorship, and/or publication of this article. This work was supported in part by Instituto Carlos III project PI17/00335, integrated in the National R + D + I, and funded by the ISCIII and the European Regional Development Fund. SG is supported by the Catalan Health department (“Departament de Salut”) in receipt of a grant from PERIS-PIF-Salut (SLT017/20/000158). MC-S is supported by a grant from ISCIII (FI20/00021); FB is a senior researcher from Germans Trias i Pujol Health Science Research Institute, supported by the Health Department of the Catalan Government (Generalitat de Catalunya), and MF is supported by ISCIII (MS19/00018), co-funded by ERDF/ESF, “Investing in your future”. The REMAR group is recognized as a consolidated research group by Agaur (SGR-GRC-00187) and is part of the Spanish network RICORS-2040 funded by the ISCIII and the European Regional Development Funds.