. 2024 Aug 12:15:1396000.
doi: 10.3389/fimmu.2024.1396000. eCollection 2024.

The involvement of peritoneal GATA6+ macrophages in the pathogenesis of endometriosis

Affiliations

The involvement of peritoneal GATA6+ macrophages in the pathogenesis of endometriosis

Mingxin Shi et al. Front Immunol. .

Abstract

Endometriosis is a chronic inflammatory disease that causes debilitating pelvic pain in women. Macrophages are considered to be key players in promoting disease progression, as abundant macrophages are present in ectopic lesions and elevated in the peritoneum. In the present study, we examined the role of GATA6+ peritoneal macrophages on endometriosis-associated hyperalgesia using mice with a specific myeloid deficiency of GATA6. Lesion induction induced the disappearance of TIM4hi MHCIIlo residential macrophages and the influx of increased Ly6C+ monocytes and TIM4lo MHCIIhi macrophages. The recruitment of MHCIIhi inflammatory macrophages was extensive in Mac Gata6 KO mice due to the severe disappearance of TIM4hi MHCIIlo residential macrophages. Ki67 expression confirmed GATA6-dependent proliferative ability, showing different proliferative phenotypes of TIM4+ residential macrophages in Gata6f/f and Mac Gata6 KO mice. Peritoneal proinflammatory cytokines were elevated after lesion induction. When cytokine levels were compared between Gata6f/f and Mac Gata6 KO mice, TNFα at day 21 in Gata6f/f mice was higher than in Mac Gata6 KO mice. Lesion induction increased both abdominal and hind paw sensitivities. Gata6f/f mice tended to show higher sensitivity in the abdomen after day 21. Elevated expression of TRPV1 and CGRP was observed in the dorsal root ganglia after ELL induction in Gata6f/f mice until days 21 and 42, respectively. These results support that peritoneal GATA6+ macrophages are involved in the recruitment and reprogramming of monocyte-derived macrophages. The extensive recruitment of monocyte-derived macrophages in Mac Gata6 KO mice might protect against inflammatory stimuli during the resolution phase, whereas GATA6 deficiency did not affect lesion initiation and establishment at the acute phase of inflammation. GATA6+ residential macrophages act to sustain local inflammation in the peritoneum and sensitivities in the neurons, reflecting endometriosis-associated hyperalgesia.

Keywords: GATA6; endometriosis; inflammation; pain; peritoneal macrophages.


Conflict of interest statement

The authors declare that the research was conducted in the absence of any commercial or financial relationships that could be construed as a potential conflict of interest.

Figures
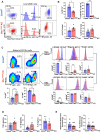
Figure 1
Figure 1
Comparison of peritoneal immune cell profiles between Gata6f/f and Mac Gata6 KO mice. (A) Representative flow plots illustrating the composition of CD11b+, GATA6+, CD3+, and CD19+ cells in Gata6f/f and Mac Gata6 KO mice. (B) Proportions of CD11b+, GATA6+, CD3+, and CD19+ in Gata6f/f and Mac Gata6 KO mice. (C) Flow cytometric analysis of CD11b+ subsets. Bottom left: Proportions of Ly6C+ and TIM4+ cells from CD11b+ subsets. Right panel: TIM4+ (top) and TIM4- (bottom) cells were further gated with F4/80, MHCII, and Ki67. Results were shown as representative overlaid histogram plots (Gata6f/f in blue and Mac Gata6 KO in red) with summarized bar plots below. (D) Proinflammatory cytokine levels (TNFα, IL-1β, and IL-6) in the peritoneal fluid were analyzed by IQELISA. (E) Abdominal and hind paw hyperalgesia were analyzed using the von Frey test. Data were analyzed by the Mann-Whitney test and shown mean ± SEM (n=5). *P < 0.05, **P < 0.01.
Figure 2
Figure 2
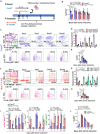
Characterization of peritoneal macrophage profiling following lesion induction in Gata6f/f and Mac Gata6 KO mice. (A) Experimental study design as described in Materials and Methods. (B) Graph summarizing flow cytometry data for the proportion of CD11b+ cells on Days 3, 7, 21, and 42 after endometriosis-like lesions (ELL) induction (n=5). Two-way ANOVA was performed to determine the main effects of ELL induction (depicted as ELL), GATA6 status (depicted as GATA6), and the interaction effect between the two factors (depicted as Int.). The differences between Gata6f/f and Mac Gata6 KO mice at each time point were compared by the Multiple Mann-Whitney test. (C, F) Representative flow cytometric plots showing the dynamics of macrophages following ELL induction in Gata6f/f (C) and Mac Gata6 KO mice (F). CD11b+ cells were further gated by TIM4 and MHCII (top) or Ly6C (bottom) (n=5). Statistical analysis of TIM4high(hi) MHCIIlow(lo) (pink), TIM4inter(int) MHCIIhi (yellow), and TIM4lo MHCIIhi (green) cells in Gata6f/f mice (D), or TIM4hi MHCIIhi (pink), TIM4int MHCIIhi (yellow), and TIM4lo MHCIIhi (green) cells in Mac Gata6 KO mice (G) was performed with two-way ANOVA to determine the time-dependent difference after ELL induction (depicted as ELL), the mean difference among cell populations (depicted as Group), and the interaction effect between the two factors (depicted as Int.). Time course analysis for Ly6C+ cells in (E, H) was conducted by one-way ANOVA with Dunnett’s multiple comparisons test. *P < 0.05, and ****P < 0.0001. (I) Time-dependent proportions of TIM4hi (pink), TIM4int (yellow), TIM4lo (green) cells, and (J) Ly6C+ cells in Gata6f/f and Mac Gata6 KO mice (n=5). Data were analyzed by two-way ANOVA and Multiple Mann-Whitney tests as described in (B). *P < 0.05. Data are presented as the mean ± SEM.
Figure 3
Figure 3
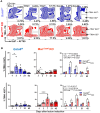
Analysis of TIM4+ Ki67+ and TIM4- Ki67+ cells in CD11b+ subsets after ELL induction in Gata6f/f and Mac Gata6 KO mice. (A) Representative flow cytometric plots of CD11b+ cells gated with TIM4 and Ki67. (B) Bar graphs showing the TIM4+ Ki67+ (top panel) and TIM4- Ki67+ (bottom panel) cell percentages in Gata6 f/f in blue, or Mac Gata6 KO in red, or together. Data are presented as the mean ± SEM (n=5). One-way ANOVA, followed by Dunnett’s multiple comparison test, was used to analyze the time-dependent differences in each group. Two-way ANOVA was performed to determine the main effects of ELL induction (depicted as ELL), GATA6 status (depicted as GATA6), and the interaction effect between the two factors (depicted as Int.). The differences between Gata6f/f and Mac Gata6 KO mice at each time point were compared by the Multiple Mann-Whitney test. *P < 0.05, ***P < 0.001.
Figure 4
Figure 4
Proinflammatory cytokine levels (TNFα, IL-1β, and IL-6) after ELL induction in Gata6f/f and Mac Gata6 KO mice. Cytokine levels were shown in a single group (A) or grouped plots (B). Data are presented as the mean ± SEM (n=5). (A) Data were analyzed with one-way ANOVA followed by Dunnett’s multiple comparisons test. **P < 0.01, ***P < 0.001, and ****P < 0.0001. (B) Two-way ANOVA was performed to analyze the main effects of ELL induction (depicted as ELL), GATA6 status (depicted as GATA6), and the interaction effect between the two factors (depicted as Int.). The difference between Gata6f/f and Mac Gata6 KO mice at each time point was determined by the Multiple Mann-Whitney test. *P < 0.05.
Figure 5
Figure 5
Evaluation of endometriosis-associated hyperalgesia followed by ELL induction in Gata6f/f and Mac Gata6 KO mice. Abdominal and hind paw withdrawal thresholds were assessed by the von Frey test in Gata6f/f and Mac Gata6 KO mice. Data are shown by individual group (A) and grouped graphs (B) as mean ± SEM (n = 10). (A) Date were analyzed with one-way ANOVA followed by Dunnett’s multiple comparison test. *P < 0.05, **P < 0.01, ***P < 0.001, ****P < 0.0001. (B) Two-way ANOVA was performed to analyze the main effects of ELL induction (depicted as ELL), GATA6 status (depicted as GATA6), and the interaction effect between the two factors (depicted as Int.). The difference between Gata6f/f and Mac Gata6 KO mice at each time point was determined by the Multiple Mann-Whitney test.
Figure 6
Figure 6
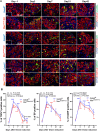
Expression of TRPV1, SP, and CGRP in DRG from Gata6f/f and Mac Gata6 KO mice after ELL induction. (A) Representative images showing DRG sections double stained with TRPV1, SP, or CGRP (green), and PGP9.5 (red), as a marker of DRG cell body. (B) Quantification of TRPV1+, SP+, or CGRP+ cells in PGP9.5+ cells. Data are shown as the mean ± SEM (n=5). Two-way ANOVA was performed to analyze the main effects of ELL induction (depicted as ELL), GATA6 status (depicted as GATA6), and the interaction effect between the two factors (depicted as Int.). Following two-way ANOVA, Dunnett’s multiple comparison test was used to analyze time-dependent differences compared with day -1 within a group labeled blue (Gata6f/f ) or red (Mac Gata6 KO). The difference between Gata6f/f and Mac Gata6 KO mice at each time point was determined by the Multiple Mann-Whitney test. *P < 0.05, **P < 0.01, ***P < 0.001, ****P < 0.0001.
Figure 7
Figure 7
Analysis of ELL in Gata6f/f and Mac Gata6 KO mice. (A) Quantification of lesion numbers in Gata6f/f and Mac Gata6 KO mice after ELL induction (n=10). (B) Representative immunohistochemical images (left) and quantification (right) of CD68+ macrophages in the lesions of Gata6f/f and Mac Gata6 KO mice on days 21 and 42 (n=5). Data are shown as the mean ± SEM. Two-way ANOVA was performed to analyze the main effects of ELL induction (depicted as ELL), GATA6 status (depicted as GATA6), and the interaction effect between the two factors (depicted as Int.). The difference between Gata6f/f and Mac Gata6 KO mice at each time point was determined by the Multiple Mann-Whitney test. No significant difference was detected.

Similar articles

References

    1. Saunders PTK, Horne AW. Endometriosis: etiology, pathobiology, and therapeutic prospects. Cell. (2021) 184:2807–24. doi: 10.1016/j.cell.2021.04.041 - DOI - PubMed
    1. Zondervan KT, Becker CM, Missmer SA. Endometriosis. New Engl J Med. (2020) 382:1244–56. doi: 10.1056/NEJMra1810764 - DOI - PubMed
    1. Nnoaham KE, Hummelshoj L, Webster P, d'Hooghe T, de Cicco Nardone F, de Cicco Nardone C, et al. . Impact of endometriosis on quality of life and work productivity: A multicenter study across ten countries. Fertility Sterility. (2011) 96:366–73 e8. doi: 10.1016/j.fertnstert.2011.05.090 - DOI - PMC - PubMed
    1. Sepulcri Rde P, do Amaral VF. Depressive symptoms, anxiety, and quality of life in women with pelvic endometriosis. Eur J Obstet Gynecol Reprod Biol. (2009) 142:53–6. doi: 10.1016/j.ejogrb.2008.09.003 - DOI - PubMed
    1. Simoens S, Dunselman G, Dirksen C, Hummelshoj L, Bokor A, Brandes I, et al. . The burden of endometriosis: costs and quality of life of women with endometriosis and treated in referral centres. Hum Reprod. (2012) 27:1292–9. doi: 10.1093/humrep/des073 - DOI - PubMed

MeSH terms