[Preprint]. 2024 Aug 15:2024.08.14.607425.
doi: 10.1101/2024.08.14.607425.

Structural Analyses of a GABARAP~ATG3 Conjugate Uncover a Novel Non-covalent Ubl-E2 Backside Interaction

Affiliations

Structural Analyses of a GABARAP~ATG3 Conjugate Uncover a Novel Non-covalent Ubl-E2 Backside Interaction

Kazuto Ohashi et al. bioRxiv. .

Abstract

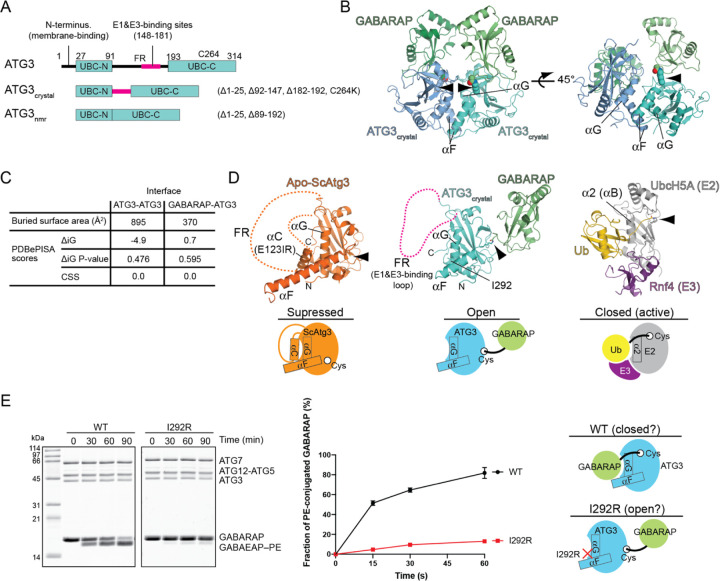
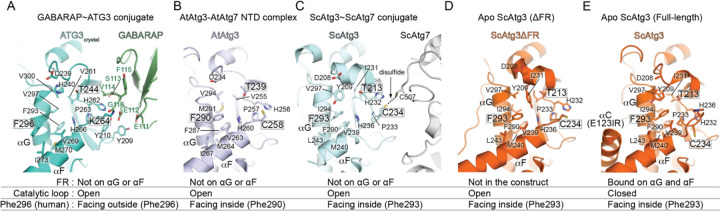
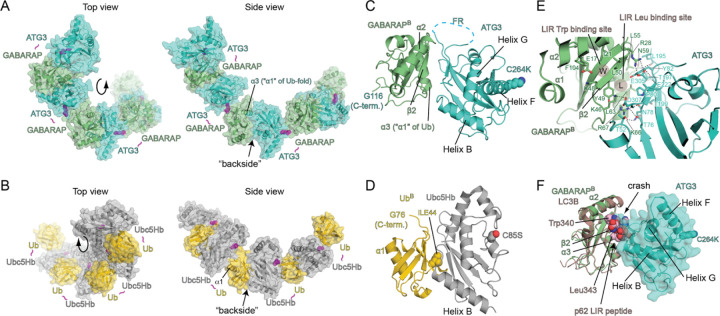
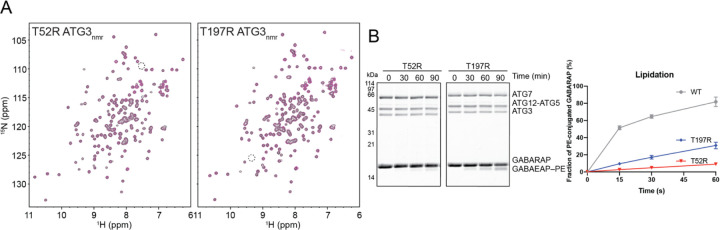
Members of the ATG8 family of ubiquitin-like proteins (Ubls) are conjugated to phosphatidylethanolamine (PE) in the autophagosomal membrane, where they recruit degradation substrates and facilitate membrane biogenesis. Despite this well-characterized function, the mechanisms underlying the lipidation process, including the action of the E2 enzyme ATG3, remain incompletely understood. Here, we report the crystal structure of human ATG3 conjugated to the mammalian ATG8 protein GABARAP via an isopeptide bond, mimicking the Ubl~E2 thioester intermediate. In this structure, the GABARAP~ATG3 conjugate adopts an open configuration with minimal contacts between the two proteins. Notably, the crystal lattice reveals non-covalent contacts between GABARAP and the backside of ATG3's E2 catalytic center, resulting in the formation of a helical filament of the GABARAP~ATG3 conjugate. While similar filament formations have been observed with canonical Ub~E2 conjugates, the E2 backside-binding interface of GABARAP is distinct from those of Ub/Ubl proteins and overlaps with the binding site for LC3 interacting region (LIR) peptides. NMR analysis confirms the presence of this non-covalent interaction in solution, and mutagenesis experiments demonstrate the involvement of the E2 backside in PE conjugation. These findings highlight the critical role of the E2 backside in the lipidation process and suggest evolutionary adaptations in the unique E2 enzyme ATG3.


Figures

Figure 1.
Figure 1.
Crystal structure of the GABARAP~ATG3 conjugate mimic. (A) The primary structure of human ATG3 and the constructs used in this study. (B) The crystal structure of the GABARAP~ATG3crystal isopeptide conjugate. The two molecules of the GABARAP~ATG3crystal conjugate in the asymmetric unit are shown. The covalent linkages between Lys264ATG3 and Gly116GABARAP are indicated by arrowheads. (C) Metrics from a PDBePISA analysis of the molecular interfaces within the asymmetric unit. (D) Structural comparisons of the GABARAP~ATG3crystal conjugate (middle) with apo ScAtg3 (left, PDB ID: 2DYT) and the Ub~Ubc5HA (E2)-Rnf4 (E3) complex (right, PDB ID: 1Z5S]). Cartoons depict the state of each structure. (E) GABARAP–PE conjugation assay with wild-type and I292R mutant ATG3. SDS-PAGE analysis of the reaction is shown on the left. ATG16N is not visible on the SDS-PAGE due to its small size. The quantification of the results is shown on the right. Data points are presented as the mean ± S.D. of three independent experiments. Putative configurational states of the GABARAP~ATG3 conjugate are depicted as cartoons.
Figure 2.
Figure 2.
The catalytic centers of ATG3/Atg3 structures. (A) The GABARAP~ATG3 isopeptide conjugate. (B) The AtAtg3-AtAtg7 NTD complex (PDB ID: 3VX8). (C) ScAtg3~ScAtg7 disulfide-crosslinked conjugate (PDB ID: 4GSL). (D) Apo ScAtg3ΔFR (PDB ID:6OJJ). (E) Apo ScAtg3 full-length (PDB ID: 2DYT) . The states of the FR, catalytic loop, and Phe296 (Phe290/Phe293) are described at the bottom. The residues mentioned in the text are labeled in boxes.
Figure 3.
Figure 3.
Filamentous assembly of the GABARAP~ATG3 conjugate in the crystal. (A, B) Comparison of the GABARAP~ATG3crystal (A) and Ub~Ubc5Hb (PDB ID: 3A33) (B) filaments in crystals. (C, D) Structures of the non-covalent ATG3-GABARAPB (C) and Ubc5Hb-UbB (D) pairs shown in an orientation where ATG3 and Ubc5Hb are structurally aligned. (E) Close-up view of the non-covalent interface between ATG3 and GABARAPB. (F) Superimposition of the LC3B-p62 LIR peptide complex (PDB ID: 2ZJD) on the structure of the non-covalent ATG3-GABARAPB pair. The p62 LIR peptide, shown in sphere, sterically crashes into the ATG3 backside.
Figure 4.
Figure 4.
The GABARAP~ATG3 conjugate interacts in solution. (A, B) 1H-15N HSQC spectrum of the GABARAP (15N-labeled)~ATG3 (non-labeled) conjugate in the absence (A) or the presence (B) of p62 LIR peptides (non-labeled). Both spectra are shown in black. Also shown in (B) is the spectrum of the non-conjugated 15N-GABARAP in complex with p62 LIR peptide (non-labeled) in magenta. The magenta peaks that shift or are absent in the black spectrum are labeled with their assignments. (C) The residues labeled in (B) are shown in yellow and as sticks representation in the GABARAP~ATG3 crystal structure.
Figure 5.
Figure 5.
GABARAP interacts non-covalently with the backside of ATG3’s catalytic site in solution. (A) Overlay of HSQC spectra of 15N-labeled ATG3nmr titrated with unlabeled GABARAP. The peaks that shifted or broadened upon the addition of GABARAP are labeled with their residue assignments. (B) Titration curves of the chemical shift changes of peaks that shifted more than 0.06 ppm are shown with fitted curves. (C) Plot of the combined 1H and 15N chemical shift changes of ATG3 peaks as a function of residue number. (D) Plot of ratios of 1H-15N peak intensities of the final GABARAP titration point compared to the initial ones. (E) Chemical shift perturbation plotted on each residue of ATG3 structure. The residues whose peak shifted more than 0.03 ppm (above the dotted line in (C)) or lost signal intensity by more than 60% (below the dotted line in (D)) are colored yellow and labeled on the surface of ATG3. The catalytic residue C264 is shown in magenta and labeled as its mutated form (C264K). On the right, the non-covalently contacting pair of ATG3 and GBRB in the crystal structure is shown.
Figure 6.
Figure 6.
The ATG3 backside is important for GABARAP–PE conjugation. (A) Overlays of 1H-15N HSQC spectra of ATG3nmrT52R (left) and ATG3nmrT197R (right) without (black peaks) and with GABARAP (red peaks) are shown. The positions of the Thr52 and Thr197 amide resonances in the wild-type spectrum (Fig. 5A) are indicated by dotted circles. (B) GABARAP–PE conjugation by the mutants. The data and quantification are presented in the same manner as in Fig. 1E.

Similar articles

References

    1. Dikic I, Elazar Z. Mechanism and medical implications of mammalian autophagy. Nat Rev Mol Cell Biol. 2018;19(6):349–64. Epub 2018/04/06. doi: 10.1038/s41580-018-0003-4. - DOI - PubMed
    1. Levine B, Kroemer G. Biological Functions of Autophagy Genes: A Disease Perspective. Cell. 2019;176(1–2):11–42. Epub 2019/01/12. doi: 10.1016/j.cell.2018.09.048. - DOI - PMC - PubMed
    1. Nakatogawa H. Mechanisms governing autophagosome biogenesis. Nat Rev Mol Cell Biol. 2020;21(8):439–58. Epub 2020/05/07. doi: 10.1038/s41580-020-0241-0. - DOI - PubMed
    1. Mizushima N, Levine B. Autophagy in Human Diseases. The New England journal of medicine. 2020;383(16):1564–76. Epub 2020/10/15. doi: 10.1056/NEJMra2022774. - DOI - PubMed
    1. Noda NN, Ohsumi Y, Inagaki F. Atg8-family interacting motif crucial for selective autophagy. FEBS Lett. 2010;584(7):1379–85. Epub 2010/01/20. doi: 10.1016/j.febslet.2010.01.018. - DOI - PubMed

Publication types

LinkOut - more resources