. 2024 Aug 26;19(1):62.
doi: 10.1186/s13024-024-00746-4.

Pathological characteristics of axons and alterations of proteomic and lipidomic profiles in midbrain dopaminergic neurodegeneration induced by WDR45-deficiency

Affiliations

Pathological characteristics of axons and alterations of proteomic and lipidomic profiles in midbrain dopaminergic neurodegeneration induced by WDR45-deficiency

Panpan Wang et al. Mol Neurodegener. .

Abstract

Background: Although WD repeat domain 45 (WDR45) mutations have been linked to β -propeller protein-associated neurodegeneration (BPAN), the precise molecular and cellular mechanisms behind this disease remain elusive. This study aims to shed light on the impacts of WDR45-deficiency on neurodegeneration, specifically axonal degeneration, within the midbrain dopaminergic (DAergic) system. We hope to better understand the disease process by examining pathological and molecular alterations, especially within the DAergic system.

Methods: To investigate the impacts of WDR45 dysfunction on mouse behaviors and DAergic neurons, we developed a mouse model in which WDR45 was conditionally knocked out in the midbrain DAergic neurons (WDR45cKO). Through a longitudinal study, we assessed alterations in the mouse behaviors using open field, rotarod, Y-maze, and 3-chamber social approach tests. We utilized a combination of immunofluorescence staining and transmission electron microscopy to examine the pathological changes in DAergic neuron soma and axons. Additionally, we performed proteomic and lipidomic analyses of the striatum from young and aged mice to identify the molecules and processes potentially involved in the striatal pathology during aging. Further more, primary midbrain neuronal culture was employed to explore the molecular mechanisms leading to axonal degeneration.

Results: Our study of WDR45cKO mice revealed a range of deficits, including impaired motor function, emotional instability, and memory loss, coinciding with the profound reduction of midbrain DAergic neurons. The neuronal loss, we observed massive axonal enlargements in the dorsal and ventral striatum. These enlargements were characterized by the accumulation of extensively fragmented tubular endoplasmic reticulum (ER), a hallmark of axonal degeneration. Proteomic analysis of the striatum showed that the differentially expressed proteins were enriched in metabolic processes. The carbohydrate metabolic and protein catabolic processes appeared earlier, and amino acid, lipid, and tricarboxylic acid metabolisms were increased during aging. Of note, we observed a tremendous increase in the expression of lysophosphatidylcholine acyltransferase 1 (Lpcat1) that regulates phospholipid metabolism, specifically in the conversion of lysophosphatidylcholine (LPC) to phosphatidylcholine (PC) in the presence of acyl-CoA. The lipidomic results consistently suggested that differential lipids were concentrated on PC and LPC. Axonal degeneration was effectively ameliorated by interfering Lpcat1 expression in primary cultured WDR45-deficient DAergic neurons, proving that Lpcat1 and its regulated lipid metabolism, especially PC and LPC metabolism, participate in controlling the axonal degeneration induced by WDR45 deficits.

Conclusions: In this study, we uncovered the molecular mechanisms underlying the contribution of WDR45 deficiency to axonal degeneration, which involves complex relationships between phospholipid metabolism, autophagy, and tubular ER. These findings greatly advance our understanding of the fundamental molecular mechanisms driving axonal degeneration and may provide a foundation for developing novel mechanistically based therapeutic interventions for BPAN and other neurodegenerative diseases.

Keywords: Autophagy; Axonal degeneration; Lpcat1; Phospholipid metabolism; Tubular ER; WDR45.


Conflict of interest statement

The authors declare that the research was conducted without any commercial or financial relationships that could be construed as a potential conflict of interest.

Figures
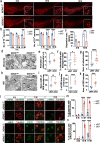
Fig. 1
Fig. 1
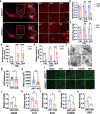
DAergic neuronal reduction in the SN. a IFC staining was performed using an antibody against TH (red) in midbrains from young (6–8 months old), middle-aged (11–13 months old), and aged (17–19 months old) WDR45cWT and WDR45cKO mice. Scale bar, 250 μm. Scale bar for high-magnification images, 10 μm. b Quantifying TH-positive neurons in the VTA and SNc of WDR45cWT and WDR45cKO mice (N = 5 mice per genotype). c The dopamine concentration in the SN region was detected by high-performance liquid chromatography (N = 3–5 mice per genotype). d Representative TEM images of observed mitochondria in aged WDR45cWT mice and WDR45cKO mice. Scale bar, 500 nm. e Quantification of the perimeter of mitochondria in DAergic neurons (N = 154 mitochondria collectively counted from 9 slices of 3 WDR45cWT mice and 251 mitochondria from 9 slices of 3 WDR45cKO mice). f The proportion of mitochondria with damaged cristae was quantified (N = 15 slices from 3 mice per genotype). g The mean number of mitochondria observed in captured images was collected (N = 15 slices from 3 mice for each genotype). h Representative TEM images of observed RER. Scale bar, 500 nm. i The mean width of RER tubules is shown (N = 163 RER collectively counted from 9 slices of 3 WDR45cWT mice and 288 RER from 9 slices of 3 WDR45cKO mice). j The proportion of RER tubules (> 100 nm) was quantified (N = 15 slices from 3 mice per genotype). k The mean number of RER observed in captured images was collected (N = 15 slices from 3 mice for each genotype). l Double-label immunofluorescence of p-RIPK3 (Thr 231/Ser232) or p-MLKL (phosphor S345) (green) with TH (red) in the DAergic neurons of young, middle-aged, and aged WDR45cWT mice and WDR45cKO mice. Scale bar, 10 μm. m The proportion of TH-positive neurons with p-RIPK3 puncta was quantified. (N = 3 mice per genotype). n The proportion of TH-positive neurons with p-MLKL puncta was quantified. (N = 3 mice per genotype). Data were analyzed using two-way ANOVA followed by Sidak’s multiple comparisons tests (b, c, m, n) and Student’s t-test (e–g, i-k). Data are represented as the mean ± SEM. *p < 0.05, ***p < 0.001, ****p < 0.0001
Fig. 2
Fig. 2
Axonal degeneration in the striatum of WDR45cKO mice. a IFC staining for striatal axons, including the NAc and CPu, was performed using an antibody against TH (red) in young, middle-aged, and aged WDR45cWT and WDR45cKO mice. Scale bar, 200 μm. For high-magnification images: 50 μm. b, c Quantifying the fiber density in the NAc and CPu, respectively (N = 3 mice per genotype). d, e The calculation of densities of DA axonal enlargements (area > 5 μm2) per 0.045 mm2 perspective in the NAc and CPu from WDR45cWT and WDR45cKO mice, respectively (N = 3–7 slices from 3 mice per genotype). f Representative TEM images of the observed PSD. Scale bar, 100 nm. The red arrowhead indicates PSD. g, h The PSD width and PSD area were quantified (N = 33 PSD collectively counted from 3 WDR45cWT mice and 35 PSD from 3 WDR45cKO mice). i IFC analysis of synapse-related proteins in the striatum of aged WDR45cWT mice and WDR45cKO mice. Scale bar, 20 μm. j Quantifying PSD95' fluorescence density (N = 7–8 slices from 3 mice per genotype). k Quantifying SYT1' fluorescence density (N = 11 slices from 3 mice per genotype). l Quantifying SYN1' fluorescence density (N = 5–6 slices from 3 mice per genotype). m Quantifying HOMER1' fluorescence density (N = 5 slices from 3 mice per genotype). n Quantifying BSN' fluorescence density (N = 7–8 slices from 3 mice per genotype). Data (b-e) were analyzed using two-way ANOVA followed by Sidak’s multiple comparisons test and Student’s t-test (g, h, j-n). Data are represented as the mean ± SEM. *p < 0.05, **p < 0.01, ***p < 0.001, ****p < 0.0001
Fig. 3
Fig. 3
Increasing fragmented tubular ER constitutes a pathological feature of axons in WDR45cKO mice. a IFC analysis for RTN3 in the NAc of WDR45cWT mice and WDR45cKO mice was performed using antibodies against RTN3 (green) and TH (red). The nuclei were labeled with DAPI (blue). Scale bar, 10 μm. b IFC staining for REEP2 in the NAc of aged WDR45cWT mice and WDR45cKO mice was performed using antibodies against REEP2 (green) and TH (red). The nuclei were labeled with DAPI (blue). Scale bar, 10 μm. c IFC staining for REEP5 in the NAc of aged WDR45cWT mice and WDR45cKO mice was performed using antibodies against REEP5 (green) and TH (red). The nuclei were labeled with DAPI (blue). Scale bar, 10 μm. d Analysis of relative density of RTN3- and TH-positive enlargements in the NAc of aged WDR45cWT mice and WDR45cKO mice (N = 5–9 slices from 3 mice per genotype). e Analysis of relative density of REEP2- and TH-positive enlargements in the NAc of aged WDR45cWT mice and WDR45cKO mice (N = 9 slices from 3 mice per genotype). f Analysis of relative density of REEP5- and TH-positive enlargements in the NAc of aged WDR45cWT mice and WDR45cKO mice (N = 9 slices from 3 mice per genotype). g-j Samples from aged WDR45cWT mice and WDR45cKO mice were examined by TEM, and representative TEM images of observed tubular ER at the axons of the striatum are shown. The tubular ER is highlighted in black. Scale bar, 500 nm. For enlarged images, 250 nm. k The mean length of tubular ER was analyzed from aged WDR45cWT mice and WDR45cKO mice (N = 8–9 slices from 3 mice for each genotype). Data were analyzed by using Student’s t-test. Data are represented as the mean ± SEM. ****p < 0.0001. White arrows indicate axonal enlargements
Fig. 4
Fig. 4
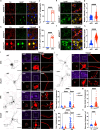
Disrupted autophagic flux in the DAergic neurons may contribute to the accumulation of tubular ER in axons. a Left panel: IFC staining for p62 (purple) and Ub (green) in the TH-positive neurons (red) of WDR45cWT mice and WDR45cKO mice. The nuclei were labeled with DAPI (blue). Scale bar, 10 μm. Right panel: IFC staining for LC3 (green) in the TH-positive (red) DAergic neurons. The nuclei were labeled with DAPI (blue). Scale bar, 10 μm. b The proportion of TH-positive neurons with p62 puncta (> 0.5 μm2) is presented (N = 3 mice per genotype). c The proportion of TH-positive neurons with Ub-positive puncta (> 0.5 μm2) is presented (N = 3 mice per genotype). d The proportion of TH-positive neurons with LC3-positive puncta (> 0.5 μm2) is presented (N = 3 mice per genotype). e–h LC3 (green), Lamp1 (red), Ub (green), and p62 (green) were detected in the NAc of aged WDR45cWT mice and WDR45cKO mice. The nuclei were labeled with DAPI (blue). Scale bar, 10 μm. i-k IFC staining of RTN3, REEP2, and REEP5 in the NAc of 12-month-old VMP1cWT mice and VMP1cKO mice was performed using antibodies against RTN3 or REEP2 or REEP5 (green) with TH (red), respectively. The nuclei were labeled with DAPI (blue). Scale bar, 10 μm. l-n Analysis of the relative density of RTN3- and TH-positive enlargements, REEP2- and TH-positive enlargements, and REEP5- and TH-positive enlargements (> 5 μm2), respectively (N = 5–9 slices from 3 mice per genotype). Data were analyzed using two-way ANOVA followed by Sidak’s multiple comparisons tests (b-d) and Student’s t-test (l-n). Data are represented as the mean ± SEM. ****p < 0.0001, **p < 0.01
Fig. 5
Fig. 5
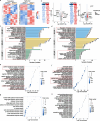
The proteome landscape of striatum in the WDR45 cKO mice. a The heatmap of the DEPs from young and aged WDR45cWT mice and WDR45cKO mice. b Volcano plots and top 20 up- or down-regulated DEPs organized by fold change in the striatum of young and aged WDR45cKO mice vs. WDR45cWT mice (DEPs marked by red and blue circles). The top 10 CC, MF, and BP terms in GO annotation analysis for DEPs from (c) young and (d) aged WDR45cWT mice and WDR45cKO mice. The top 20 terms related to BP in the GO enrichment analysis for DEPs from (e) young and (f) aged WDR45cWT mice and WDR45cKO mice. The top 20 terms related to MF in the GO enrichment analysis for DEPs from (g) young and (h) aged WDR45cWT mice and WDR45cKO mice. Data were analyzed by using the Student’s t-test. Data are represented as the mean ± SEM. ****p < 0.0001
Fig. 6
Fig. 6
The connection of the phospholipid metabolism with the striatal pathology. GO analysis for BP displays up-regulated DEPs (pink) (a) and downregulated DEPs (green) (b) that participate in the regulation of lipid metabolism. Lower blue bars represent the magnitude of p values. Percentages indicate the fraction of each category of total up- or down-regulated DEPs. c The Venn diagram of the number of DEPs in young and aged groups. d PLS-DA score plot of the lipidomic profile of striatum tissues from both young and aged WDR45cKO mice and WDR45cWT mice in positive mode. R2X = 0.454, R2Y = 0.492, Q2 = 0.219. e PLS-DA score plot of the lipidomic profile of striatum tissues from both young and aged WDR45cKO mice and WDR45cWT mice in negative mode. R2X = 0.518, R2Y = 0.510, Q2 = 0.271. f Volcano plot of DELs between young WDR45cKO mice and WDR45cWT mice. g Volcano plot of DELs between aged WDR45cKO mice and WDR45cWT mice. h Venn diagram of the number of DELs between WDR45cKO mice and WDR45cWT mice in young and aged groups. Heat maps of DELs between WDR45cKO mice and WDR45cWT mice in (i) young groups, (j) aged group, and (k) both young and aged groups. Percentage of DELs in each lipid class between WDR45cKO mice and WDR45cWT mice in (l) young groups, (m) aged group, and (n) both young and aged groups
Fig. 7
Fig. 7
Disturbance of Lpcat1 expression ameliorates DAergic axonal degeneration. IFC staining for Lpcat1 in the striatum of young (a) and aged (b) WDR45cWT mice and WDR45cKO mice was performed using antibodies against Lpcat1 (green) and TH (red), and the analysis of Lpcat1- and TH-positive enlargements (c, d) (N = 15 slices from 3 mice per genotype). The nuclei were labeled with DAPI (blue). Scale bar, 10 μm. IFC analysis for Lpcat1 in the DAergic  in the SNc of young (e) and aged (f) WDR45cWT mice and WDR45cKO mice was performed using antibodies against Lpcat1 (green) and TH (red), and the analysis of relative fluorescence intensity for Lpcat1(g, h) (N = 141 neurons from 3 young WDR45cWT mice, 183 neurons from 3 young WDR45cKO mice, 198 neurons from 3 aged WDR45cWT mice, and 281 neurons from 3 aged WDR45cKO mice). The nuclei were labeled with DAPI (blue). Scale bar, 10 μm. i IFC staining for primary culture of DAergic neurons by using antibodies against Lpcat1 (pseudo-color) and TH (red), and the analysis of the mean density and total areas of enlargements per DAergic neuron (j, k) (N = 50–73 primary DAergic neurons collected from 3 P0 pups per group). Scale bar, 50 μm. Scale bar for high-magnification images, 20 μm. l IFC staining for primary culture of DAergic neurons by using antibodies against Lpcat1 (pseudo-color) and TH (red), and the analysis of the mean density and mean area of enlargements in each DAergic neuron (m, n) (N = 64–88 primary DAergic neurons collected from 3 P0 pups per group). Scale bar, 50 μm. Scale bar for high-magnification images, 20 μm. Data (j, k) were analyzed using two-way ANOVA followed by Tukey's multiple comparisons test, and Student’s t-test for data (c, d, g, h, m, n). Data are represented as the mean ± SEM. ****p < 0.0001. White arrows indicate axonal enlargements
Fig. 8
Fig. 8
The potential interactions of autophagy, phospholipid metabolism, and tubular ER in the striatal pathology of WDR45-deficiency-induced DAergic neurodegeneration. The dysfunction of WDR45 impairs the DAergic neuronal autophagic process, an intracellular degradation system and compensation mechanism for energy supply, leading to protein accumulation and inhibition of damaged organelles turnover, then developing into the long-term metabolic disorders in striatal region and ultimately accelerating the axonal degeneration. The phospholipid metabolism interacts with amino acid metabolism and potentially regulates energy production. Additionally, the phospholipid metabolic process plays a role in the composition of tubular ER structural phospholipids. These complex interactions jointly regulate axonal homeostasis. The black bold texts represent the up-regulated DEPs from the current proteome analysis, and the red bold texts represent the DEPs we further examined experimentally. Black arrows show single-step enzyme catalysis. The black dashed arrows indicate multi-step enzyme catalysis. The right panel shows the perturbed pathways in phospholipid metabolism, Gly-Ser-Thr metabolism, Ala-Asp-Glu metabolism, and pyruvate metabolism, as well as the interactions among them. Abbreviations: Gly, glycine; Ser, serine; Thr, threonine; Ala, alanine; Asp, aspartate; Glu, glutamate; Lpcat1, lysophosphatidylcholine acyltransferase 1; CKI1, choline kinase1; Etnppl, ethanolamine-phosphate phospho-lyase; CBS, cystathionine beta-synthase; SDS, L-serine/L-threonine ammonia-lyase; SARDH, sarcosine dehydrogenase; ASNS, asparagine synthase; Doec, aspartate-semialdehyde dehydrogenase; GOT1, aspartate aminotransferase1; GDHA, glutamate dehydrogenase; GFPT, glutamine-fructose-6-phosphate transaminase; GLUL, glutamine synthetase

Update of

Similar articles

References

    1. Ebrahimi-Fakhari D, Saffari A, Wahlster L, Lu J, Byrne S, Hoffmann GF, et al. Congenital disorders of autophagy: an emerging novel class of inborn errors of neuro-metabolism. Brain. 2016;139(Pt 2):317–37. 10.1093/brain/awv371 - DOI - PMC - PubMed
    1. Stirnimann CU, Petsalaki E, Russell RB, Muller CW. WD40 proteins propel cellular networks. Trends Biochem Sci. 2010;35(10):565–74. 10.1016/j.tibs.2010.04.003 - DOI - PubMed
    1. Zheng JX, Li Y, Ding YH, Liu JJ, Zhang MJ, Dong MQ, et al. Architecture of the ATG2B-WDR45 complex and an aromatic Y/HF motif crucial for complex formation. Autophagy. 2017;13(11):1870–83. 10.1080/15548627.2017.1359381 - DOI - PMC - PubMed
    1. Wan H, Wang Q, Chen X, Zeng Q, Shao Y, Fang H, et al. WDR45 contributes to neurodegeneration through regulation of ER homeostasis and neuronal death. Autophagy. 2020;16(3):531–47. 10.1080/15548627.2019.1630224 - DOI - PMC - PubMed
    1. Noda M, Ito H, Nagata KI. Physiological significance of WDR45, a responsible gene for beta-propeller protein associated neurodegeneration (BPAN), in brain development. Sci Rep. 2021;11(1):22568. 10.1038/s41598-021-02123-3 - DOI - PMC - PubMed

Substances

LinkOut - more resources