. 2024 Aug 26;12(1):46.
doi: 10.1038/s41413-024-00349-1.

Schnurri-3 inhibition rescues skeletal fragility and vascular skeletal stem cell niche pathology in the OIM model of osteogenesis imperfecta

Affiliations

Schnurri-3 inhibition rescues skeletal fragility and vascular skeletal stem cell niche pathology in the OIM model of osteogenesis imperfecta

Na Li et al. Bone Res. .

Abstract

Osteogenesis imperfecta (OI) is a disorder of low bone mass and increased fracture risk due to a range of genetic variants that prominently include mutations in genes encoding type I collagen. While it is well known that OI reflects defects in the activity of bone-forming osteoblasts, it is currently unclear whether OI also reflects defects in the many other cell types comprising bone, including defects in skeletal vascular endothelium or the skeletal stem cell populations that give rise to osteoblasts and whether correcting these broader defects could have therapeutic utility. Here, we find that numbers of skeletal stem cells (SSCs) and skeletal arterial endothelial cells (AECs) are augmented in Col1a2oim/oim mice, a well-studied animal model of moderate to severe OI, suggesting that disruption of a vascular SSC niche is a feature of OI pathogenesis. Moreover, crossing Col1a2oim/oim mice to mice lacking a negative regulator of skeletal angiogenesis and bone formation, Schnurri 3 (SHN3), not only corrected the SSC and AEC phenotypes but moreover robustly corrected the bone mass and spontaneous fracture phenotypes. As this finding suggested a strong therapeutic utility of SHN3 inhibition for the treatment of OI, a bone-targeting AAV was used to mediate Shn3 knockdown, rescuing the Col1a2oim/oim phenotype and providing therapeutic proof-of-concept for targeting SHN3 for the treatment of OI. Overall, this work both provides proof-of-concept for inhibition of the SHN3 pathway and more broadly addressing defects in the stem/osteoprogenitor niche as is a strategy to treat OI.


Conflict of interest statement

The authors declare no competing interests.

Figures
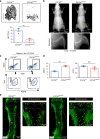
Fig. 1
Fig. 1
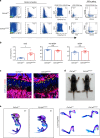
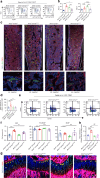
Altered skeletal vascular composition in Col1a2oim/oim mice. a Representative μCT images of trabecular bone in the distal femur (left) and bone volume/total volume (BV/TV) (right) in Col1a2+/+ and Col1a2oim/oim male mice at 6 weeks of age (n = 3). b Representative X-ray images of Col1a2+/+ and Col1a2oim/oim male mice at 4 weeks of age. Scale bars, 1 cm (n = 3). c Representative flow cytometry plots and (d) quantitative analysis of arterial endothelial cells (AECs) and sinusoidal endothelial cells (SECs). Results are presented as mean ± SEM; **P < 0.01 by an unpaired two-tailed Student’s t test in all panels, N.S. not significant. e Representative confocal images of femur tissue clearing from 3-week-old Col1a2+/+ and Col1a2oim/oim mice stained with α-SMA (Green). Scale bars, 500 μm
Fig. 2
Fig. 2
Elevated abundance of skeletal stem cells in Col1a2oim/oim mice. a Flow cytometry gating strategies for analysis of SSC, pre-BCSP and BCSP proportions. b Dot plot for analysis of SSC, pre-BCSP and BCSP proportions in Col1a2oim/oim mice and Col1a2+/+ littermate controls. Results represented as mean ± SEM; *P < 0.05 by an unpaired two-tailed Student’s t test in all panels, N.S. not significant. c Representative confocal images (n = 3 total images per group) of femur sections from 3-week-old Col1a2+/+ and Col1a2oim/oim male mice stained with CD200 (Red) Sox9 (Green) and DAPI (Blue). Scale bars, 50 μm. d Whole body image of Col1a2+/+ and Col1a2oim/oim at postnatal day 7. e Alcian blue and alizarin red staining of skeletal preparations of newborn mice at postnatal day 7
Fig. 3
Fig. 3
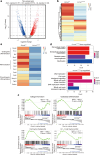
Col1a2oim/oim SSCs display cell-intrinsic transcriptional alterations and functional defects in osteogenic capacity. a Volcano plot illustrating differentially regulated gene expression from Bulk RNA-seq analysis between the 7-day postnatal control Col1a2+/+ mice SSCs and SSCs from the Col1a2oim/oim mice. b Hierarchical clustering based on Euclidian distance using Illumina TruSeq RNA Sample Preparation kit and sequenced on Illumina HiSeq 4000. Blue, downregulated; Red, upregulated. c Gene set enrichment plot demonstrated activation of Collagen formation, Osteoblast differentiation, Cell cycle checkpoints and G1-S cell cycle control signaling. Col1a2+/+ and Col1a2oim/oim represent mixture 3 biologically distinct samples. The expression pattern of genes involved in the Collagen formation, Osteoblast differentiation, cell cycle checkpoints and G1-S cell cycle control signaling set in the analysis database is shown. NES normalized enrichment score. Blue, downregulated; Red, upregulated. d Gene Ontology (GO) functional clustering of the interested downregulated and upregulated biological process (BP) in Col1a2oim/oim mice SSCs. (Top, downregulated; Bottom, upregulated). e Heatmap for osteogenic cartilage-related gene expression in Col1a2+/+ mice SSCs (left) and Col1a2oim/oim mice SSCs (right)
Fig. 4
Fig. 4
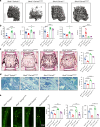
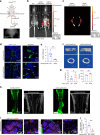
Deletion of SHN3 improves bone properties in Col1a2oim/oim mice. a Representative μCT images of the trabecular bone in the distal femur metaphysis and (b) relative quantitative analysis of BV/TV in Shn3+/+Col1a2+/+ and Shn3+/+Col1a2oim/oim and Shn3−/−Col1a2+/+ and Shn3−/−Col1a2oim/oim male mice. Analysis at 6 weeks of age. Scale bars, 1 mm. Values were presented as mean ± SEM; *P < 0.05, **P < 0.01 and ****P < 0.000 1 by an unpaired two-tailed Student’s t test in all panels. c Representative images and BV/TV analysis of Von Kossa staining and the quantification of histomorphometric parameters of L3 vertebrae in Shn3+/+Col1a2+/+ and Shn3+/+Col1a2oim/oim and Shn3−/−Col1a2+/+ and Shn3−/−Col1a2oim/oim male mice at 6 weeks of age, Scale bars, 500 μm (n = 4 for each group). d Representative histological images of the L3 vertebrae with Toluidine blue staining and the quantification of histomorphometric parameters in Shn3+/+Col1a2+/+ and Shn3+/+Col1a2oim/oim and Shn3−/−Col1a2+/+ and Shn3−/−Col1a2oim/oim male mice at 6 weeks of age. Trabecular osteoblast surface/bone surface [(Ob.S/BS)/%] are shown. Scale bars, 50 μm. Shn3+/+Col1a2+/+ (n = 4), Shn3+/+Col1a2oim/oim (n = 5), Shn3−/−Col1a2+/+ (n = 5), Shn3−/−Col1a2oim/oim (n = 4). e Representative images of calcein double labeling and quantification of histomorphometric parameters of the L3 vertebrae in Shn3+/+Col1a2+/+ and Shn3+/+Col1a2oim/oim and Shn3−/−Col1a2+/+ and Shn3−/−Col1a2oim/oim male mice at 6 weeks of age. Trabecular mineralizing surface/bone surface [(MS/BS)/%] mineral apposition rate [MAR/(μm/d)], bone formation rate/bone surface [(BFR/BS)/(μm3/μm2/year)] are shown. Scale bars, 100 μm. Shn3+/+Col1a2+/+ (n = 3), Shn3+/+Col1a2oim/oim (n = 4), Shn3−/−Col1a2+/+ (n = 4), Shn3−/−Col1a2oim/oim (n = 4)
Fig. 5
Fig. 5
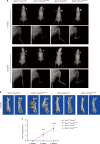
Ablation of SHN3 prevents spontaneous fractures in Col1a2oim/oim mice. a Representative X-ray image of Shn3+/+Col1a2+/+ and Shn3+/+Col1a2oim/oim and Shn3−/−Col1a2+/+ and Shn3−/−Col1a2oim/oim male mice at 4 and 8 weeks age. Scale bar: 2 mm. b Reconstruction of μCT data reflected spontaneous bone fracture in Shn3+/+Col1a2+/+ and Shn3+/+Col1a2oim/oim and Shn3−/−Col1a2+/+ and Shn3−/−Col1a2oim/oim male mice at 8 weeks age. c Relative quantification of spontaneous bone fracture numbers in Shn3+/+Col1a2+/+ and Shn3+/+Col1a2oim/oim and Shn3−/−Col1a2+/+ and Shn3−/−Col1a2oim/oim male mice after the birth of 1 weeks. Analysis at 1, 5 and 9 weeks of age. Values represent mean ± SEM; **P < 0.01 and ***P < 0.001 by an unpaired two-tailed Student’s t test in all panels
Fig. 6
Fig. 6
SHN3 deficiency corrects abnormal vascular and SSC composition in Col1a2oim/oim mice. a Experimental strategy and representative flow cytometry plots (b) and relative frequency of arterial endothelial cells (AECs) and sinusoidal endothelial cells (SECs). c Representative confocal images (n = 3 total images per group) of femur sections from 3-week-old Shn3+/+Col1a2+/+ and Shn3+/+Col1a2oim/oim and Shn3−/−Col1a2+/+ and Shn3−/−Col1a2oim/oim male mice stained with EMCN (Red) and α-SMA (Green), DAPI (Blue). Arrows show significant differences area in bone marrow. (Top, lower power; Bottom, higher power). Scale bars, 100 μm (low power) and 50 μm (high power). d Quantification of α-SMA positive cells in femur bone marrow. (n = 5; data are presented as means ± SEM, P values, two-tailed unpaired t-test). e Experimental strategy and representative flow cytometry plots (f) and relative frequency of SSCs, Pre-BCSP, BCSP. g Representative confocal images (n = 3 total images per group) of femur sections from 3-week-old Shn3+/+Col1a2+/+ and Shn3+/+Col1a2oim/oim and Shn3−/−Col1a2+/+ and Shn3−/−Col1a2oim/oim male mice stained with antibodies recognizing Sox9 (Green), CD200 (Red) and or DAPI (Blue). Scale bars, 50 μm. h Quantification of CD200 and Sox9 positive cells in resting zone of distal-femur growth plates. (n = 3; data are presented as means ± SEM, P values, two-tailed unpaired t-test)
Fig. 7
Fig. 7
SHN3-silencing is a candidate therapeutic approach for OI. a Schematic diagram of strategy for rAAV9-amiR-ctrl or amiR-shn3 injected into knee joints in 4 weeks old Col1a2oim/oim, rAAV9-amiR-ctrl in the left hindlimbs and amiR-shn3 in the right hindlimbs, sacrificed in 12 weeks old. b, c Two months after i.a. injection of rAAV9 carrying amiR-ctrl or amiR-shn3 into knee joints of 1-month-old male mice, EGFP expression was assessed by IVIS Lumina III optical imaging. d Two months after i.a. injection of rAAV9 carrying amiR-ctrl or amiR-shn3 into knee joints of 1-month-old male mice, the vector-driven EGFP signal in trabecular bone was visualized by fluorescence microscopy of cryo-sectioned femurs. e Two months after i.a. injection of rAAV9 carrying amiR-ctrl or amiR-shn3 into knee joints of 1-month-old male mice, Shn3 mRNAs normalized to hprt were assessed in femur bone was assessed by real-time PCR. f Two months after i.a. injection of rAAV9 carrying amiR-ctrl or amiR-shn3 into knee joints of 1-month-old male mice, femoral trabecular bone mass was assessed by μCT. g Representative 3D reconstruction and relative quantification are displayed (n = 3 per group), Scale bars, 100 μm. h Two months after i.a. injection of rAAV9 carrying amiR-ctrl or amiR-shn3 into knee joints of 1-month-old male mice, representative confocal images of femur tissue clearing from 3 month-old Col1a2+/+ and Col1a2oim/oim mice stained with α-SMA (Green). Scale bars, 500 μm. i Two months after i.a. injection of rAAV9 carrying amiR-ctrl or amiR-shn3 into knee joints of 1-month-old male mice, the vector-driven EGFP signal in trabecular bone was visualized by fluorescence microscopy of cryo-sectioned femurs. Cryo-sectioned femurs were also immunostained with CD200 (Red) and DAPI (Blue). j Quantification of CD200 positive cells in resting zone of distal-femur growth plates. Right panels show magnified area of central growth plates. (n = 4; data are presented as means ± SEM, P values, two-tailed unpaired t-test)

Update of

Similar articles

References

    1. Marini, J. C. et al. Osteogenesis imperfecta. Nat. Rev. Dis. Prim.3, 17052 (2017). - PubMed
    1. Rauch, F. & Glorieux, F. H. Osteogenesis imperfecta. Lancet363, 1377–1385 (2004). - PubMed
    1. Palomo, T. et al. Intravenous bisphosphonate therapy of young children with osteogenesis imperfecta: skeletal findings during follow up throughout the growing years. J. Bone Miner. Res.30, 2150–2157 (2015). - PubMed
    1. Glorieux, F. H. et al. Cyclic administration of pamidronate in children with severe osteogenesis imperfecta. N. Engl. J. Med.339, 947–952 (1998). - PubMed
    1. Orwoll, E. S. et al. Evaluation of teriparatide treatment in adults with osteogenesis imperfecta. J. Clin. Investig.124, 491–498 (2014). - PMC - PubMed

Substances