. 2024 Oct;94(4):571-583.
doi: 10.1007/s00280-024-04701-4. Epub 2024 Aug 24.

Continuous exposure to doxorubicin induces stem cell-like characteristics and plasticity in MDA-MB-231 breast cancer cells identified with the SORE6 reporter

Affiliations

Continuous exposure to doxorubicin induces stem cell-like characteristics and plasticity in MDA-MB-231 breast cancer cells identified with the SORE6 reporter

Nohemí Salinas-Jazmín et al. Cancer Chemother Pharmacol. 2024 Oct.

Abstract

Purpose: Cancer stem cells (CSCs) account for recurrence and resistance to breast cancer drugs, rendering them a cause of mortality and therapeutic failure. In this study, we examined the effects of exposure to low concentrations of doxorubicin (Dox) on CSCs and non-CSCs from TNBC.

Methods: The effects of Dox were studied using the SORE6 reporter system. We examined the enrichment of the CSCs population, as well as the proliferation, and death of the reporter-positive fraction (GFP + cells) by flow cytometry. The resistant and stemness phenotypes were analyzed by viability and mammosphere formation assay, respectively. We identified differentially expressed and coregulated genes by RNA-seq analysis, and the correlation between gene expression and clinical outcome was evaluated by Kaplan-Mayer analysis using public databases.

Results: In MDAMB231 and Hs578t cells, we identified enriched subsets in the CSCs population after continuous exposure to low concentrations of Dox. Cells from these enriched cultures showed resistance to toxic concentrations of Dox and increased efficiency of mammosphere formation. In purified GFP + or GFP- cells, Dox increased the mammosphere-forming efficiency, promoted phenotypic switches in non-CSCs populations to a CSC-like state, reduced proliferation, and induced differential gene expression. We identified several biological processes and molecular functions that partially explain the development of doxorubicin-resistant cells and cellular plasticity. Among the genes that were regulated by Dox exposure, the expression of ITGB1, SNAI1, NOTCH4, STAT5B, RAPGEF3, LAMA2, and GNAI1 was significantly associated with poor survival, the stemness phenotype, and chemoresistance.

Conclusion: The generation of chemoresistant cells that have characteristics of CSCs, after exposure to low concentrations of Dox, involves the differential expression of genes that have a clinical impact.

Keywords: Breast cancer; CSC-like; Doxorubicin; Drug-resistance; Plasticity.


Conflict of interest statement

The authors declare no competing interests.

Figures

Fig. 1
Fig. 1
Exposure to low concentrations of doxorubicin enriches GFP + cells (CSC-like) in MDA-MB-231-SORE cell cultures. A Exposure schedule to 1–10 nM of doxorubicin (Dox) for 4 months. B FACS analysis demonstrates the enrichment of GFP + cells in cultures exposed to Dox; values are expressed as mean ± standard deviation (SD). Student’s test **p < 0.01 vs. control (n = 12)
Fig. 2
Fig. 2
Continuous exposure to doxorubicin induces a drug-resistant phenotype and CSC-like characteristics in TNBC cells. A Cytotoxicity was compared between parental MDA-MB-231 cells (control) and MDA-MB-231 cells exposed to doxorubicin (Dox) at the IC50 or IC75 of Dox, evaluated by MTT assay. B Mammosphere formation in MDA-MB-231 cells exposed to doxorubicin for 4 months. Graphs show results from 4 assays evaluated in quadruplicate and the mean ± SEM. Representative pictures are shown; bar = 100 μm. Statistical significance was determined by Tukey’s multiple comparisons test against the control or student’s test; p < 0.05 (*), < 0.01 (**). MFE: mammospheres-forming efficiency
Fig. 3
Fig. 3
Doxorubicin increases mammosphere-forming efficiency in GFP + and GFP- cell populations. A FACS analysis of the purification efficiency of GFP + and GFP- populations. B Mammosphere formation in purified cells exposed to doxorubicin for 4 months. Graphs show results of 4 assays evaluated in quadruplicate and the mean ± SEM. Representative pictures are shown; bar = 100 μm. Statistical significance was determined by Tukey’s multiple comparisons test against the control; p < 0.05 (*). MFE: mammospheres-forming efficiency
Fig. 4
Fig. 4
Plasticity of GFP- population (non-CSCs) from culture exposed to doxorubicin. A Time course showing that sorted GFP- populations have plastic potential to generate GFP + populations in culture. Three assays evaluated by duplicate and the mean ± SEM. Statistical significance was determined by Sidak’s multiple comparisons test against the control; p < 0.01 (**); B FACS analyses of third passage after sorting of GFP- population. C. Expression of SOX2 and OCT4 in purified cells exposed to doxorubicin for 4 months was measured by RT-qPCR. Error bars represent the standard error of the mean (SEM) of three biological replicates. Statistical significance was determined by student’s test; p = 0.035 (*)
Fig. 5
Fig. 5
Exposure to doxorubicin increases cell proliferation in GFP- populations (plastic cells), compared with GFP + cells (CSC-like). A. FACS analysis demonstrating that doxorubicin (Dox) reduces cell proliferation in unsorted and sorted cell populations. In comparing GFP + and GFP- populations, the latter exhibits a higher proliferation rate. B. The graphs show data from two assays, each evaluated in triplicate and display the mean ± SEM. Statistical significance was determined using either the student´s test or Tukey’s multiple comparisons test against the control group; p < 0.05 (*); < 0.01 (**)
Fig. 6
Fig. 6
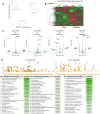
RNA-seq analysis of GFP + and GFP- populations exposed to doxorubicin. A. Principal component analysis (PCA) and subsequent visualization of PC1 and PC2 resulting in sample clustering. B. Heatmap of differentially expressed genes that are upregulated (red) or downregulated (green) in GFP + or GFP- populations (Control and Dox-resistant cells). C. Volcano plot of differential gene expression of GFP-/GFP + cells between control and doxorubicin-exposed conditions; genes acquired by DESeq2 (p value (–log10FDR) are plotted against fold-change (|log2-fold change|). Gene ontology analysis of differentially expressed genes in GFP- populations from the control culture and GFP- populations exposed to prolonged doxorubicin. D. Biological processes and E. molecular functions with adjusted P values less than 0.05, obtained from gProfiler. F. Analysis of ITGB1, LAMA2, GNAI1, NOTCH4, RAPGEF3, STAT5B, and SNAl1 expression in breast tumors and clinical correlation. Heatmaps of mRNA levels of differentially expressed genes in breast tumors and their corresponding normal tissues. Comparison of expression of genes in breast tumors vs normal tissue (cohort: TCGA TARGET GTEx database of breast cancer patients obtained from UCSC Xena). Statistical analysis was performed using Welch’s t-test. N.S. non-significant. Overall survival curve in TNBC patients from TGCA cohort. All plots were generated using the UCSC Xena browser. Kaplan-Meyer analysis comparing patients with high (red) and low (blue) expression of genes; P values calculated by log-rank test. Threshold of Cox p value
Fig. 6
Fig. 6
RNA-seq analysis of GFP + and GFP- populations exposed to doxorubicin. A. Principal component analysis (PCA) and subsequent visualization of PC1 and PC2 resulting in sample clustering. B. Heatmap of differentially expressed genes that are upregulated (red) or downregulated (green) in GFP + or GFP- populations (Control and Dox-resistant cells). C. Volcano plot of differential gene expression of GFP-/GFP + cells between control and doxorubicin-exposed conditions; genes acquired by DESeq2 (p value (–log10FDR) are plotted against fold-change (|log2-fold change|). Gene ontology analysis of differentially expressed genes in GFP- populations from the control culture and GFP- populations exposed to prolonged doxorubicin. D. Biological processes and E. molecular functions with adjusted P values less than 0.05, obtained from gProfiler. F. Analysis of ITGB1, LAMA2, GNAI1, NOTCH4, RAPGEF3, STAT5B, and SNAl1 expression in breast tumors and clinical correlation. Heatmaps of mRNA levels of differentially expressed genes in breast tumors and their corresponding normal tissues. Comparison of expression of genes in breast tumors vs normal tissue (cohort: TCGA TARGET GTEx database of breast cancer patients obtained from UCSC Xena). Statistical analysis was performed using Welch’s t-test. N.S. non-significant. Overall survival curve in TNBC patients from TGCA cohort. All plots were generated using the UCSC Xena browser. Kaplan-Meyer analysis comparing patients with high (red) and low (blue) expression of genes; P values calculated by log-rank test. Threshold of Cox p value

Similar articles

References

    1. Arnold M, Morgan E, Rumgay H, Mafra A, Singh D, Laversanne M et al (2022) Current and future burden of breast cancer: global statistics for 2020 and 2040. The Breast 66:15–23. 10.1016/j.breast.2022.08.010 - PMC - PubMed
    1. Vučković L, Klisic A, Raonić J, Vućinić J (2021) Comparative study of immunohistochemical determination of breast cancer molecular subtypes on core biopsy and surgical specimens. Eur Rev Med Pharmacol Sci 25:3990–3996. 10.26355/eurrev_202106_26039 - PubMed
    1. Hammerl D, Smid M, Timmermans AM, Sleijfer S, Martens JWM, Debets R (2018) Breast cancer genomics and immuno-oncological markers to guide immune therapies. Semin Cancer Biol 52:178–188. 10.1016/j.semcancer.2017.11.003 - PubMed
    1. Waks AG, Winer EP (2019) Breast cancer treatment: a review. JAMA 321:288–300. 10.1001/JAMA.2018.19323 - PubMed
    1. Kerr AJ, Dodwell D, McGale P, Holt F, Duane F, Mannu G et al (2022) Adjuvant and neoadjuvant breast cancer treatments: A systematic review of their effects on mortality. Cancer Treat Rev 105:102375. 10.1016/j.ctrv.2022.102375 - PMC - PubMed

MeSH terms

LinkOut - more resources