. 2024 Aug 22;14(1):19538.
doi: 10.1038/s41598-024-70430-6.

Machine learning developed a macrophage signature for predicting prognosis, immune infiltration and immunotherapy features in head and neck squamous cell carcinoma

Affiliations

Machine learning developed a macrophage signature for predicting prognosis, immune infiltration and immunotherapy features in head and neck squamous cell carcinoma

Yao Wang et al. Sci Rep. .

Abstract

Macrophages played an important role in the progression and treatment of head and neck squamous cell carcinoma (HNSCC). We employed weighted gene co-expression network analysis (WGCNA) to identify macrophage-related genes (MRGs) and classify patients with HNSCC into two distinct subtypes. A macrophage-related risk signature (MRS) model, comprising nine genes: IGF2BP2, PPP1R14C, SLC7A5, KRT9, RAC2, NTN4, CTLA4, APOC1, and CYP27A1, was formulated by integrating 101 machine learning algorithm combinations. We observed lower overall survival (OS) in the high-risk group and the high-risk group showed elevated expression levels in most of the immune checkpoint and human leukocyte antigen (HLA) genes, suggesting a strong immune evasion capacity. Correspondingly, TIDE score positively correlated with risk score, implying that high-risk tumors may resist immunotherapy more effectively. At the single-cell level, we noted macrophages in the tumor microenvironment (TME) predominantly stalled in the G2/M phase, potentially hindering epithelial-mesenchymal transition and playing a crucial role in the inhibition of tumor progression. Finally, the proliferation and migration abilities of HNSCC cells significantly decreased after the expression of IGF2BP2 and SLC7A5 reduced. It also decreased migration ability of macrophages and facilitated their polarization towards the M1 direction. Our study constructed a novel MRS for HNSCC, which could serve as an indicator for predicting the prognosis, immune infiltration and immunotherapy for HNSCC patients.

Keywords: HNSCC; Immunotherapy; Macrophage; Prognostic model; Risk score.


Conflict of interest statement

The authors declare no competing interests.

Figures
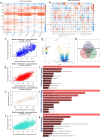
Figure 1
Figure 1
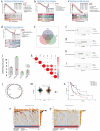
Construction of a co-expression network involving macrophage-related genes (MRGs) and identification MRGs using weighted gene coexpression network analysis. (a, b) Heatmap demonstrating the correlation between module eigengenes and macrophages in TCGA-HNSCC and GSE146771 datasets. (c) The blue module had a significant correlation with macrophages in the TCGA-HNSCC dataset (Cor = 0.79, p < 1e−200). (d–f) The M0, M1, and M2 macrophages had the strongest correlation with the red, tan, and turquoise modules, respectively (M0: Cor = 0.7, p < 1e−200, M1: Cor = 0.79, p = 4.6e−49, M2: Cor = 0.63, p < 1e−200). (g) The volcano plot showing the genes with significant differences in the top six positions in TCGA-HNSCC dataset. (h) Venn diagram displaying the macrophage-related selected intersection genes from different datasets. (i–k) Functional enrichment analysis on the 194 intersected MRGs using Kyoto Encyclopedia of Genes and Genomes (KEGG), Molecular Signatures Database (MisgDB), and Reactome databases.
Figure 2
Figure 2
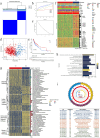
Cluster analysis of intersected MRGs in the TCGA cohort. (a) Consensus clustering identified two clusters of HNSCC with different macrophages infiltration characteristics. (b) Consensus clustering cumulative distribution function (CDF) for k = 2–6. (c) Relative change in the area under the CDF curve for k = 2–6. (d) The 2D PCA plot demonstrated the two clusters could be easily identified based on the MRGs. (e) The Kaplan–Meier curve survival analysis between different clusters. (f) Heatmap showing the distribution differences between clusters 1 and 2 in terms of clinicopathological features. (g) Heatmap displaying notable disparities between the two clusters in multiple biological processes via gene set variation analysis (GSVA). (h) The bar plot of the KEGG pathways enriched on the differentially expressed genes (DEGs) between different clusters. (i) The cluster plot of the Gene ontology (GO) pathways enriched on the DEGs between different clusters. *P < 0.05; **P < 0.01; ***P < 0.001.
Figure 3
Figure 3
Immune infiltration and tumor mutation analysis between different clusters. (a) The comparisons of stromal score, immune score, and estimated score between various clusters. (b) The comparisons of tumor purity between distinct clusters. (c) The box plot demonstrating the difference in the immune cell functions involved between the two clusters. (d) The box plot showing the difference in HLA expression between distinct clusters. (e) The box plot displaying the difference in immune checkpoint genes between the two clusters. (f–i) Immunophenoscore (IPS) analysis of CTLA4_PD1, CTLA4_PD1+, CTLA4+_PD1+ and CTLA4+_PD1 groups between various clusters. (j) The macrophage-related DEGs in HNSCC, together with their mutation rates, were displayed in a waterfall plot. (k) The comparison of tumor mutation burden (TMB) between different clusters. (l) The Kaplan–Meier curve showed the survival analysis between high- and low TMB groups. (m) The Kaplan–Meier curve showed the survival analysis combining the cluster with the TMB risk group. *P < 0.05; **P < 0.01; ***P < 0.001.
Figure 4
Figure 4
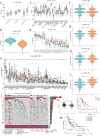
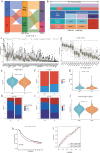
Using macrophage-related clusters as a basis, the macrophage-related signature (MRS) was developed and validated. (a) A total of 101 combinations of machine learning algorithms for the MRS via a tenfold cross-validation framework. The Kaplan–Meier curve showed the survival analysis of HNSCC patients in TCGA training (b), TCGA testing (c), which was divided based on the genes in MRS, and GSE65858 cohort (d). (e–g) The distribution of risk scores and survival statuses for patients with HNSCC in the two risk groups as determined by the TCGA training, TCGA test, and GSE65858 cohort. (h–j) The ROC analysis showed the AUCs for 1-, 3-, and 5-year OS of patients with HNSCC in the TCGA training, TCGA testing, and GSE65858 cohort. *P < 0.05; **P < 0.01; ***P < 0.001.
Figure 5
Figure 5
Construction and assessment of the survival prediction nomogram. (a, b) In the TCGA-training set, univariate and multivariate Cox regression analyses revealed that the risk score derived from clusters associated with macrophages is an independent prognostic factor that impacts the prognosis of patients with HNSCC. (c, d) In the TCGA testing set, univariate and multivariate Cox regression analyses revealed that the risk score derived from clusters associated with macrophages is an independent prognostic factor that impacts the prognosis of patients with HNSCC. (e, f) In the GSE65858 dataset, univariate and multivariate Cox regression analyses revealed that the risk score derived from clusters associated with macrophages is an independent prognostic factor that impacts the prognosis of patients with HNSCC. (g) The nomogram for the prediction of 1-, 3-, and 5-year OS of patients with HNSCC based on the risk score combined with other clinicopathological characteristics. (h) The decision curve analysis was conducted to assess the net benefit of nomogram and other clinicopathological features for predicting patient OS over the range of clinical threshold. (i) The calibration plot of nomogram exhibited strong consistence of patient OS between predicted and observed probabilities. (j–r) The boxplots showed expression differences of nine genes in MRS between tumor and adjacent normal tissues of patients with HNSCC in TCGA. *P < 0.05; **P < 0.01; ***P < 0.001.
Figure 6
Figure 6
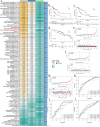
Identification of hub genes and genetic variation characteristics in high- and low-risk groups. (a–d) Enrichment plots were generated to analyze gene set enrichment in both high- and low-risk groups, depending on the risk score derived from macrophage-related clusters. (e) The Venn diagram illustrated the hub genes that were generated through the intersection of hub genes derived from the three algorithms mentioned earlier. (f–i) The box plot showed how the expression of four hub genes changed in MOC22 tumor mouse models after anti-PD1 treatment was given. (j) The box plot showed frequencies of gain and loss of the four hub genes between high- and low risk groups. (k) Circus plot exhibit the distribution on chromosomes of the four hub genes between high- and low risk groups. (l) Comparison of TMB differences between high- and low risk groups. (m) The correlation analysis revealed the relation among the expression levels of four hub genes, risk scores, and TMB. (n) The Kaplan–Meier curve displayed the survival analysis of patients with HNSCC, categorised based on both TMB groups and risk score. (o, p) Waterfall plot displaying gene mutations in the high- and low-risk groups. *P < 0.05; **P < 0.01; ***P < 0.001.
Figure 7
Figure 7
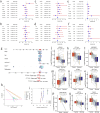
Comparison of immune subtypes and response to immunotherapy between different risk groups. (a) The Sankey diagram unveiled the potential correlation among macrophage-related cluster, risk score, and survival status. (b) Examining the variations in immune subtype between various risk categories. (c) The expression disparities of immune checkpoint genes between different risk groups. (d) The expression disparities of HLA genes between different risk groups. (e) Comparison of TIDE score in the low- and high-risk groups. (f) Comparison of positive response rates to immunotherapy between high- and low risk groups. (g) Comparison of risk scores between different immune response groups. (h, i) The composition differences of the proportion of inflammatory immune subtypes or tumor-infiltrating immune cells expressing PD-L1 between the low- and high-risk groups divided based on MRS signature of patients with metastatic urothelial carcinoma in the IMvigor210 cohort. (j) Comparison of risk scores between the CR/PR group and the SD/PD group in IMvigor210 dataset. (h) The Kaplan–Meier curve displayed the survival analysis of patients in IMvigor210 dataset, categorised based on risk score. (i) The ROC analysis showed the AUCs for 1-, 3-, and 5-year OS of patients in the IMvigor210 dataset. The specimens were categorised as immunohistochemistry IC0, IC1 or IC2 + based on the percentage of PD-L1 positive cells: less than 1%, 1% to less than 5%, or 5% or more, respectively. *P < 0.05; **P < 0.01; ***P < 0.001.
Figure 8
Figure 8
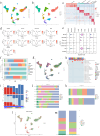
Patterns of gene expression in MRS model at the single cell level. (a) The uniform manifold approximation and projection (UMAP) plot showed all the cells in the GSE1822271 dataset can be classified into 30 clusters. (b) The UMAP plot exhibit aforementioned 30 cell clusters can be annotated as 7 major cell lineages. (c) Heatmap displayed the differentially expressed top five marker genes in each cell type. (d) The UMAP plots visualized the distribution of nine genes in MRS across different cell types. (e) Violin plots compared the expression level of nine genes in MRS. (f, g) The bar plot and UMAP plot showed the proportion of cells in distinct cell cycles. (h, i) Cellular functional pathways enriched in different cell types and their inhibition or activation status. (j) Bar plots showing the proportion of cell types in each sample. (k) Bar plots showing the proportion of cell types in patients with different HPV infection status. (l, m) The UMAP plot and bar plot displayed the proportion of cell types in high- and low-expression group divided based on the expression levels of nine genes in MRS. *P < 0.05; **P < 0.01; ***P < 0.001.
Figure 9
Figure 9
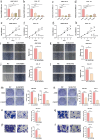
IGF2BP2 and SLC7A5 knockdown considerably inhibited proliferation and migration abilities of HNSCC cells. (a–d) Confirmation of IGF2BP2 and SLC7A5 knockdown by RT-qPCR in AMC-HN-8 and CAL 27 cells. (e–h) CCK-8 assays were conducted to investigate the proliferation ability of HNSCC cells after transfection at 24, 48, 72 and 96 h. (i–l) Wound healing assays were performed to evaluate the migratory ability of HNSCC cells after knockdown of IGF2BP2 and SLC7A5. (m, n) Colony formation assays were conducted in transfected HNSCC cells. (o–r) Transwell assays were performed to detect the migration ability of HNSCC cells after IGF2BP2 and SLC7A5 knockdown. *P < 0.05; **P < 0.01; ***P < 0.001.
Figure 10
Figure 10
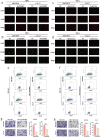
Suppression of IGF2BP2 and SLC7A5 expression in HNSCC cells attenuates macrophage migration and polarization to M2 type. THP-1 cells were cultured with supernatants from AMC-HN-8 and CAL 27 cells with or without knockdown of IGF2BP2 and SLC7A5, and the expression levels of CD86 and CD206 on the surface of THP-1 cells were examined by immunofluorescence (a–d) and flow cytometry (e, f). (g, h) AMC-HN-8 and CAL 27 cells with or without knockdown of IGF2BP2 and SLC7A5 were co-cultured with THP-1 cells using the transwell co-culture system to detect and the migratory ability of THP-1 cells was detected after 24 h. *P < 0.05; **P < 0.01; ***P < 0.001.

Similar articles

Cited by

References

    1. Global Burden of Disease Cancer Collaboration, et al. Global, Regional, and National Cancer Incidence, Mortality, Years of Life Lost, Years Lived With Disability, and Disability-Adjusted Life-years for 32 Cancer Groups, 1990 to 2015: A Systematic Analysis for the Global Burden of Disease Study. JAMA Oncol. 2017; 3(4):524–548. 10.1001/jamaoncol.2016.5688 - PMC - PubMed
    1. Takes, R. P. et al. Future of the TNM classification and staging system in head and neck cancer. Head Neck32(12), 1693–1711. 10.1002/hed.21361 (2010). 10.1002/hed.21361 - DOI - PubMed
    1. Qin, Y., Zheng, X., Gao, W., Wang, B. & Wu, Y. Tumor microenvironment and immune-related therapies of head and neck squamous cell carcinoma. Mol. Ther. Oncolytics.21(20), 342–351. 10.1016/j.omto.2021.01.011 (2021).10.1016/j.omto.2021.01.011 - DOI - PMC - PubMed
    1. Mantovani, A., Marchesi, F., Malesci, A., Laghi, L. & Allavena, P. Tumour-associated macrophages as treatment targets in oncology. Nat. Rev. Clin. Oncol.14(7), 399–416. 10.1038/nrclinonc.2016.217 (2017). 10.1038/nrclinonc.2016.217 - DOI - PMC - PubMed
    1. Yunna, C., Mengru, H., Lei, W. & Weidong, C. Macrophage M1/M2 polarization. Eur. J. Pharmacol.877, 173090. 10.1016/j.ejphar.2020.173090 (2020). 10.1016/j.ejphar.2020.173090 - DOI - PubMed

MeSH terms

Substances