. 2024 Aug 5;10(15):e35752.
doi: 10.1016/j.heliyon.2024.e35752. eCollection 2024 Aug 15.

Effects of chronic treatment with metformin on brain glucose hypometabolism and central insulin actions in transgenic mice with tauopathy

Affiliations

Effects of chronic treatment with metformin on brain glucose hypometabolism and central insulin actions in transgenic mice with tauopathy

Verónica Hurtado-Carneiro et al. Heliyon. .

Abstract

Brain glucose hypometabolism and insulin alterations are common features of many neurological diseases. Herein we sought to corroborate the brain glucose hypometabolism that develops with ageing in 12-months old Tau-VLW transgenic mice, a model of tauopathy, as well as to determine whether this model showed signs of altered peripheral glucose metabolism. Our results demonstrated that 12-old months Tau mice exhibited brain glucose hypometabolism as well as basal hyperglycemia, impaired glucose tolerance, hyperinsulinemia, and signs of insulin resistance. Then, we further studied the effect of chronic metformin treatment (9 months) in Tau-VLW mice from 9 to 18 months of age. Longitudinal PET neuroimaging studies revealed that chronic metformin altered the temporal profile in the progression of brain glucose hypometabolism associated with ageing. Besides, metformin altered the content and/or phosphorylation of key components of the insulin signal transduction pathway in the frontal cortex leading to significant changes in the content of the active forms. Thus, metformin increased the expression of pAKT-Y474 while reducing pmTOR-S2448 and pGSK3β. These changes might be related, at least partially, to a slow progression of ageing, neurological damage, and cognitive decline. Metformin also improved the peripheral glucose tolerance and the ability of the Tau-VLW mice to maintain their body weight through ageing. Altogether our study shows that the tau-VLW mice could be a useful model to study the potential interrelationship between tauopathy and central and peripheral glucose metabolism alterations. More importantly our results suggest that chronic metformin treatment may have direct beneficial central effects by post-transcriptional modulation of key components of the insulin signal transduction pathway.

Keywords: Brain; Glucose hypometabolism; Insulin resistance; Tauopathy; Transgenic mice.


Conflict of interest statement

The authors declare that they have no known competing financial interests or personal relationships that could have appeared to influence the work reported in this paper.

Figures

Fig. 1
Fig. 1
Schematic figure showing the time-course and experimental interventions corresponding to the two studies performed. First study 1: wild type (WT), Tau control (TC); Second study 2: TC and Tau metformin (TM).
Fig. 2
Fig. 2
12-months-old transgenic Tau-VLW mice are characterized by brain glucose hypometabolism. (A) Representative images depicting brain [18F]FDG uptake in Tau-VLW (white bars) vs age-matched WT mice (striped bars). (B) [18F]FDG-PET neuroimaging quantification is shown as SUV in the cortex and in the hippocampus. Data are presented as mean ± SEM (n = 7/group). Unpaired Student's t-test was used to analyse significant differences. **p < 0.01, ***p < 0.001.
Fig. 3
Fig. 3
Evaluation of peripheral markers of glucose metabolism in 12-months-old wild type and Tau-VLW mice. (A) Intraperitoneal glucose tolerance test (IpGTT) on overnight fasted mice and (B) Area under the curves. Blood glucose concentrations under basal conditions (time 0, before 2 g/kg BW glucose overload) as well as 15, 30, 60, 90, 120 and 150 min later are shown. Values are expressed as means ± SEM (WT, n = 8; Tau, n = 10). Significant differences between WT and Tau within time are depicted as *p < 0.05, **p < 0.01. The trend to significance #p = 0.08 is also shown (two-way ANOVA followed by post-hoc Bonferroni correction). Significant differences when compared with time 0 within WT (ap<0.001, bp < 0.01, the trend to significance cp = 0.06 is also shown) and, within Tau (dp < 0.001, ep < 0.01) (one-way ANOVA followed by Dunnett's correction for comparisons with time 0). &p < 0.0001, when compared area under the curves (C) Fasting plasma insulin concentrations and (D) HOMA-IR index. (WT, n = 9; Tau, n = 3). (E) Body weight. (WT, n = 8; Tau, n = 10). All values are expressed as means ± SEM. Unpaired Student's t-test was used to analyse significant differences. *p < 0.05, when comparing WT with Tau mice.
Fig. 4
Fig. 4
Effect of chronic metformin treatment on brain glucose metabolism in Tau-VLW transgenic mice. (A) Coronal, transaxial and sagittal views of the mouse MRI brain template with the regions of interests (ROIs) corresponding to the main brain areas. (B) Representative [18F]FDG-PET images in SUV scale (coronal, transaxial and sagittal planes) of TC (left panel) and TM (right panel) from 9- to 18 months-old. (C) [18F]FDG-PET SUV changes in cortex, hippocampus and whole brain. Data are shown as mean ± SEM (TC, n = 12, 12, 10 and 7 at 9, 11, 15 and 18-months-old mice, respectively; TM, n = 13, 12, 11 and 11 at 9, 11, 15 and 18-months-old mice, respectively). *p < 0.05 compared to TC; #p < 0.05 comparing TM at 18 months vs 15 months, Wilcoxon signed-rank test.
Fig. 5
Fig. 5
Evaluation of peripheral markers of glucose metabolism in 18-months-old control Tau-VLW mice (TC) and chronically (9 months) treated with metformin (TM). (A) Intraperitoneal glucose tolerance test on overnight fasted mice (IpGTT) and (B) Area under the curves. Blood glucose concentrations under basal conditions (time 0, before 2 g/kg BW glucose overload) as well as 15, 30, 60, 90, 120 and 150 min later. Values are expressed as means ± SEM (TC, n = 6; TM, n = 9). Significant differences when compared with time 0 within TC (ap<0.01) and, within TM (bp < 0.01) the trend to significance cp = 0.06 is also shown (one-way ANOVA followed by Dunnett's correction for comparisons with time 0). Significant differences between TC and TM mice in each time point are depicted as *p < 0.05, **p < 0.01 (two-way ANOVA followed by post-hoc Bonferroni correction). **p < 0.01, when compared area under the curves (Student's unpaired t-test). (C) Fasting plasma insulin concentrations and (D) HOMA-IR index. (TC, n = 3; TM, n = 4). (E) Cumulative body weight changes (% vs initial BW). (TC, n = 12, 12, 10 and 6 at 9, 11, 15 and 18-months-old mice, respectively; TM, n = 13, 12, 11 and 11, at 9, 11, 15 and 18-months-old mice, respectively). All values are expressed as means ± SEM. #p = 0.06 (Student's unpaired t-test).
Fig. 6
Fig. 6
mRNA expression of key genes involved in the insulin signalling pathway in the frontal cortex of untreated (TC) and metformin treated (TM) Tau-VLW transgenic mice. 9-months-old Tau mice were treated daily with metformin for another 9 months and then mRNA expression of the indicated genes was measured as described in Experimental procedures. Data are represented as means ± SEM (TC, n = 5; TM, n = 6).
Fig. 7
Fig. 7
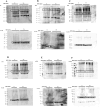
Effect of metformin on the expression of the total (A, B and C), phosphorylated (D, E and F) and active (G, H and I) forms of IR, IRS1 and PI3K, respectively, in the frontal cortex of Tau-VLW transgenic mice. 9-months-old Tau mice were treated daily with metformin for another 9 months and then the expression of the indicated proteins was measured by Western blot as described in Experimental procedures. Total and phosphorylated forms were normalized by β-actin (representative bands are showed in Supplementary Figs. 1 and 2). Phosphorylated forms normalized to the total forms are represented as active forms. Data are represented as means ± SEM (n = 4–5). Student's unpaired t-test was used to analyse significant differences. *p < 0.05, **p < 0.01. The full-length blot is provided in supplementary material as Supplementary Fig. 1 jpg and Supplementary Fig. 2 jpg.
Fig. 8
Fig. 8
Effects of metformin on the expression of the total (A, B and C), phosphorylated (D, E and F) and active (G, H and I) forms of AKT, mTOR and GSK3β, respectively, in the frontal cortex of Tau-VLW transgenic mice. 9-months-old Tau mice were treated daily with metformin for another 9 months and then the expression of the indicated proteins was measured by Western blot as described in Experimental procedures. Total and phosphorylated forms were normalized by β-actin (representative bands are showed in Supplementary Figs. 1 and 2). Phosphorylated forms normalized to the total forms are represented as active forms. Data are represented as means ± SEM (n = 4–5). Student's unpaired t-test was used to analyse significant differences. *p < 0.05, **p < 0.01, ***p < 0.001. The full-length blot is provided in supplementary material as Supplementary Fig. 1 jpg and Supplementary Fig. 2 jpg.
figs1
figs1
figs2
figs2

Similar articles

References

    1. Zhang Y., Wu K.M., Yang L., Dong Q., Yu J.T. Tauopathies: new perspectives and challenges. Mol. Neurodegener. 2022;17:28. doi: 10.1186/s13024-022-00533-z. - DOI - PMC - PubMed
    1. Banks W.A., Owen J.B., Erickson M.A. Insulin in the brain: there and back again. Pharmacol. Ther. 2012;136:82–93. doi: 10.1016/j.pharmthera.2012.07.006. - DOI - PMC - PubMed
    1. Blázquez E., Hurtado-Carneiro V., LeBaut-Ayuso Y., Velázquez E., García-García L., Gómez-Oliver F., Ruiz-Albusac J.M., Ávila J., Pozo M.Á. Significance of brain glucose hypometabolism, altered insulin signal transduction, and insulin resistance in several neurological diseases. Front. Endocrinol. 2022;13 doi: 10.3389/fendo.2022.873301. - DOI - PMC - PubMed
    1. Hoyer S. Glucose metabolism and insulin receptor signal transduction in Alzheimer disease. Eur. J. Pharmacol. 2004;490:115–125. doi: 10.1016/j.ejphar.2004.02.049. - DOI - PubMed
    1. Li X., Leng S., Song D. Link between type 2 diabetes and Alzheimer's disease: from epidemiology to mechanism and treatment. Clin. Interv. Aging. 2015;549 doi: 10.2147/CIA.S74042. - DOI - PMC - PubMed

LinkOut - more resources