. 2024 Sep;633(8029):459-464.
doi: 10.1038/s41586-024-07843-w. Epub 2024 Aug 21.

Visualizing chaperonin function in situ by cryo-electron tomography

Affiliations

Visualizing chaperonin function in situ by cryo-electron tomography

Jonathan Wagner et al. Nature. 2024 Sep.

Abstract

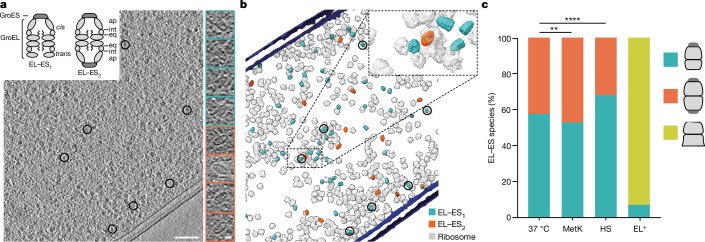
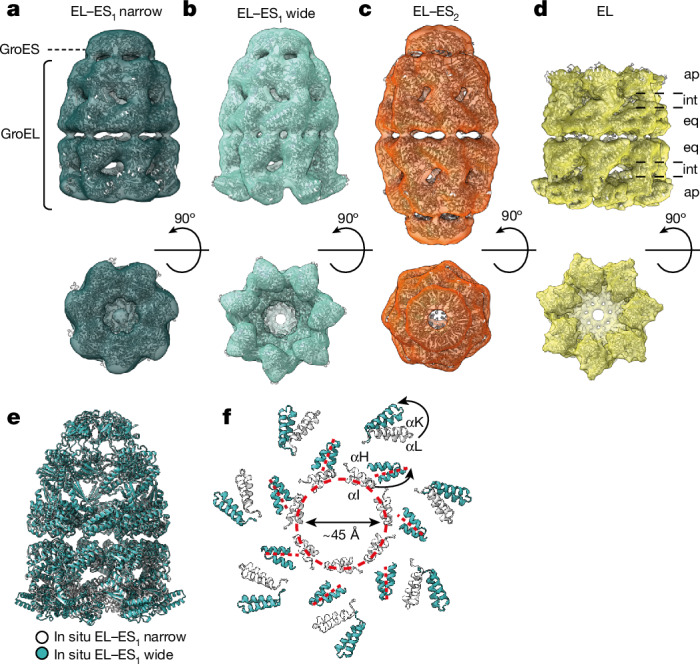
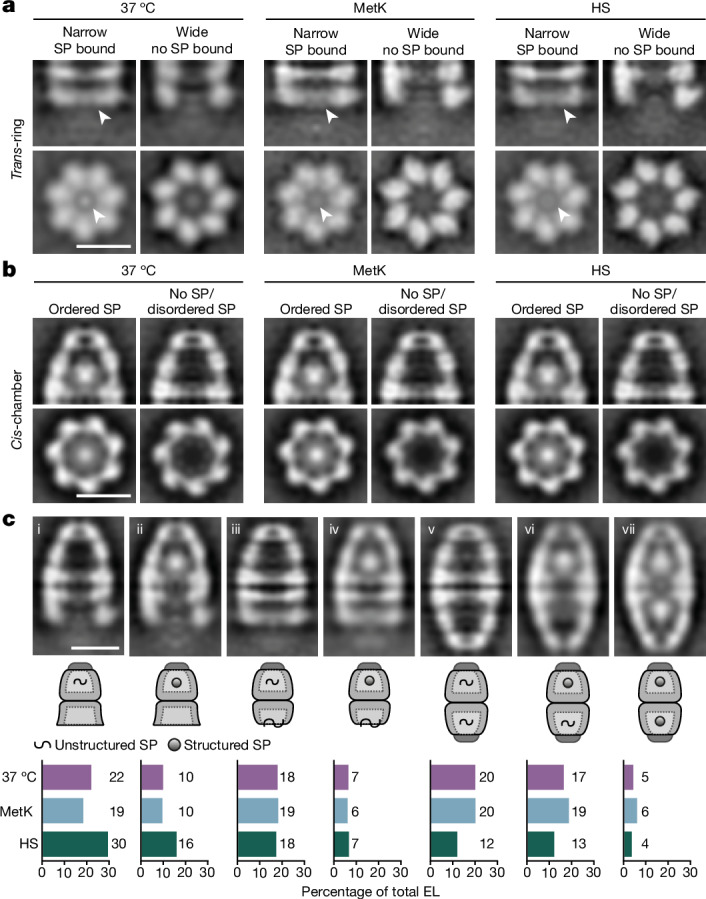
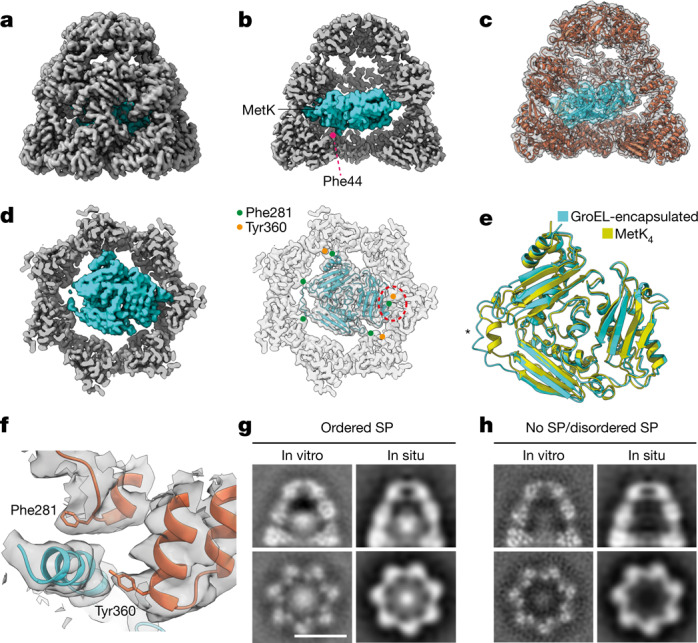
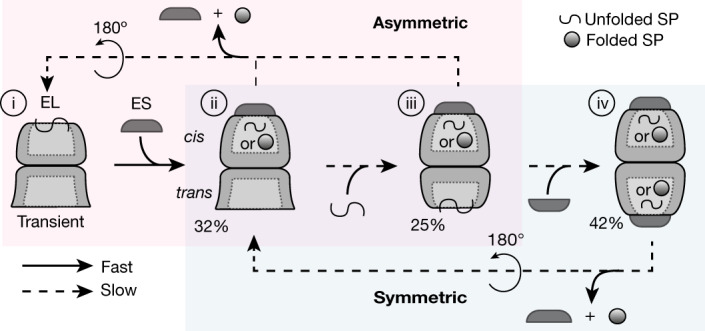
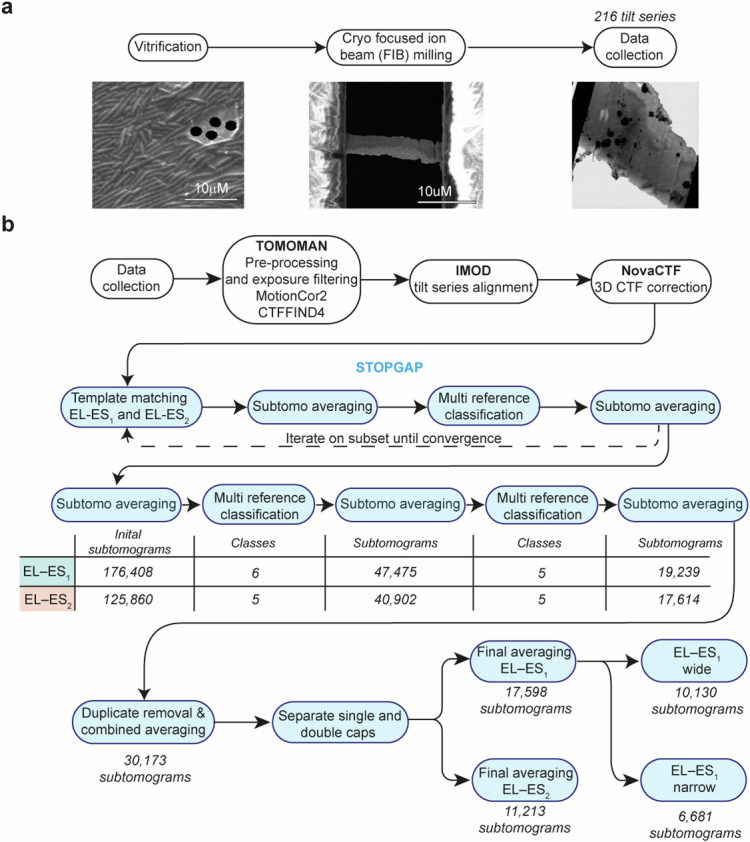
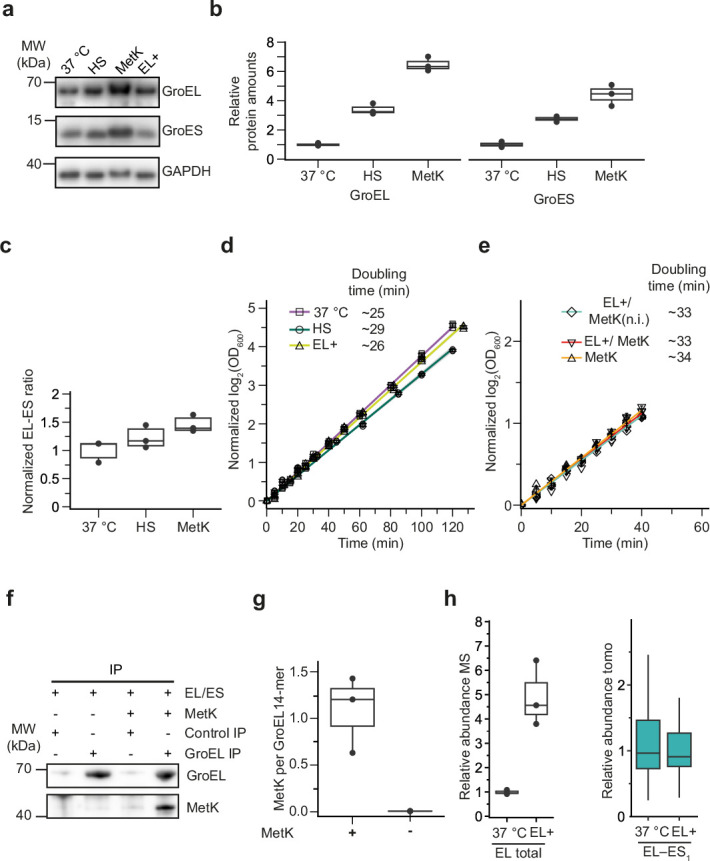
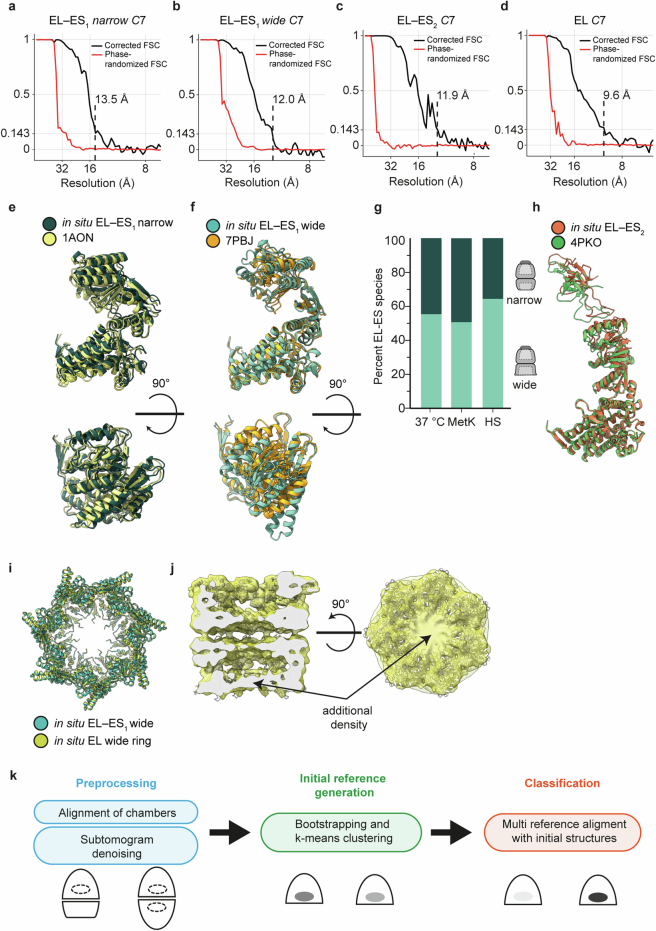
Chaperonins are large barrel-shaped complexes that mediate ATP-dependent protein folding1-3. The bacterial chaperonin GroEL forms juxtaposed rings that bind unfolded protein and the lid-shaped cofactor GroES at their apertures. In vitro analyses of the chaperonin reaction have shown that substrate protein folds, unimpaired by aggregation, while transiently encapsulated in the GroEL central cavity by GroES4-6. To determine the functional stoichiometry of GroEL, GroES and client protein in situ, here we visualized chaperonin complexes in their natural cellular environment using cryo-electron tomography. We find that, under various growth conditions, around 55-70% of GroEL binds GroES asymmetrically on one ring, with the remainder populating symmetrical complexes. Bound substrate protein is detected on the free ring of the asymmetrical complex, defining the substrate acceptor state. In situ analysis of GroEL-GroES chambers, validated by high-resolution structures obtained in vitro, showed the presence of encapsulated substrate protein in a folded state before release into the cytosol. Based on a comprehensive quantification and conformational analysis of chaperonin complexes, we propose a GroEL-GroES reaction cycle that consists of linked asymmetrical and symmetrical subreactions mediating protein folding. Our findings illuminate the native conformational and functional chaperonin cycle directly within cells.


Conflict of interest statement

The authors declare no competing interests.

Figures

Fig. 1
Fig. 1. In situ visualization and quantification of GroEL–GroES complexes.
a, Left, z-slice of a representative tomogram of an E. coli cell exposed to HS (n = 58 tomograms). GroEL–GroES complexes are represented by black circles. Top left inset, schematic representation of GroEL in asymmetrical (EL–ES1) and symmetrical (EL–ES2) complexes with apical (ap), intermediate (int) and equatorial (eq) GroEL domains indicated. The half of the EL–ES1 complex bound to ES is marked as cis and the opposing side as trans. Flexible C-terminal sequences protruding into the GroEL cavity are indicated by wavy lines. Right, gallery showing central subtomogram slices of EL–ES1 and EL–ES2 complexes in side view. b, Three-dimensional rendering of EL–ES1 complexes (blue), EL–ES2 complexes (orange) and ribosomes (light grey) from the tomogram shown in a. Cell membranes are depicted in dark blue. Complexes highlighted in a are marked by black circles. c, Relative abundance of EL–ES1 (blue), EL–ES2 (orange) and EL (yellow) complexes in tomograms from cells grown under differing conditions, and also following MetK overexpression at 37 °C (MetK). Differences in relative abundance are statistically significant, with P values (Wilcoxon rank-sum test, two-sided) of 0.007 for MetK relative to 37 °C and 5 × 10−7 for HS relative to 37 °C. P values were not corrected for multiple testing (37 °C, n = 48; HS, n = 58; MetK, n = 60 tomograms). Scale bars, 100 nm (a), 10 nm (a, right inset). Source data
Fig. 2
Fig. 2. In situ structures of chaperonin complexes.
ad, Subtomogram averages of EL–ES1 narrow (dark blue) (a), EL–ES1 wide (light blue) (b), EL–ES2 (orange) (c) and EL (yellow) (d) complexes (symmetry applied) at nominal resolutions of 10–12 Å (Extended Data Fig. 4a–d). Side and top views are shown. Ribbon representations of the models derived from STA densities for narrow EL–ES1, wide EL–ES1, EL–ES2 and open EL, respectively, are superposed. EL–ES1 and EL–ES2 complexes are derived from tomograms of cells grown at 37 °C, exposed to HS or following overexpression of MetK; EL complexes are derived from tomograms of cells with GroEL overexpression (EL+). The locations of GroES and GroEL rings are indicated in a; positions of the apical, intermediate and equatorial domains in GroEL rings, respectively, are indicated in d. e, Overlay of wide EL–ES1 in situ structure model (light blue) and the narrow EL–ES1 in situ structure model (white) by least-squares fitting of equatorial domains. Structures are shown in ribbon representation. f, Widening of the trans-ring opening from around 45 to 65 Å between in situ EL–ES1 complexes with narrow and wide trans-ring. Only the SP-binding helices αI and αH and helical hairpins αL and αK are shown. Red dashed lines indicate the SP-binding groove; curved black arrows denote reorientation of the respective domains.
Fig. 3
Fig. 3. Densities of substrate proteins in in situ structures.
a, Slices through STA densities of the trans-ring of EL–ES1 complexes from 37 °C, MetK and HS cells in side view (top) and top view (bottom). For all growth conditions, classification resulted in two distinct classes of EL–ES1 trans-rings: one with a narrow trans-ring containing a strong, localized density at the level of the apical GroEL domains (left), and one with a wide trans-ring and no extra density (right). b, Vertical and horizontal slices through STA densities of GroEL–GroES chambers from 37 °C, MetK and HS cells at the level of SP density. Processing resulted in two distinct classes of GroEL–GroES chamber: one containing a strong, localized density near the bottom of the chamber and one with only a weak, delocalized density in the chamber. Following splitting of particles based on growth conditions (37 °C, HS, MetK), the same two classes were found in all three groups. Subsequent experiments led to the assignment of encapsulated SP as either ordered or disordered. c, Vertical slices through the centre of STA densities of all GroEL–GroES species found in situ with different conformational states and SP occupancy (top), together with their relative abundance (bottom). Species i and ii are EL–ES1 complexes with a trans-ring in the wide conformation and a cis-ring with either disordered or no SP (i) or folded SP (ii). Species iii and iv are EL–ES1 complexes with a trans-ring in narrow conformation and cis-rings with either disordered or no SP (iii) or folded SP (iv). Species v–vii are EL–ES2 complexes with either no or disordered SP (v), folded SP in one chamber (vi) or folded SP in both chambers (vii), as shown schematically in pictograms. Scale bars, 10 nm. Schematic in panel c adapted from ref. , Elsevier. Source data
Fig. 4
Fig. 4. Structure of MetK inside the GroEL–GroES chamber.
ac, Structure of GroEL–GroES chambers with folded, encapsulated MetK (teal). Side view of the density (a), side view of the chamber interior (b) and superposition of the molecular model in ribbon representation (c) are shown. One of the contacts between MetK and a Phe44 residue of GroEL is indicated in b. d, Cut-away representations showing a top view of the density map (left) and the superposed MetK model (teal) in ribbon representation (right). GroEL contact residues Phe281 and Tyr360 are indicated by green and orange dots, respectively (right). A red dotted ellipse marks the area magnified in f. Phe44 residues are not visible in the slice shown. e, Overlay of the structures of GroEL–GroES-encapsulated MetK (teal) and a subunit from the isolated MetK tetramer (PDB 7LOO, yellow). Asterisk marks the core loop of MetK. f, Detailed view of a contact between MetK and GroEL in the region marked in d (right). Contact residues Phe281 and Tyr360 are shown as sticks. g,h, Slices through SPA maps obtained in situ and in vitro of GroEL–GroES chambers with ordered SP (g) and no/disordered SP (h). Grey values were normalized to the GroEL–GroES chamber for all panels. Note that these maps were symmetry averaged. Scale bar, 10 nm.
Fig. 5
Fig. 5. Mechanism for GroEL–GroES-assisted protein folding in vivo.
The interconnected reaction cycles involving asymmetric and symmetric chaperonin complexes are highlighted by a light red and light blue background, respectively. Folded SP is depicted as a sphere and unfolded SP as a wriggle. Steps assumed to be fast or slow are indicated by arrows with solid and dashed lines, respectively. Numbers below the pictograms indicate the fraction of total of the respective complex at 37 °C. The abundance of GroEL alone was estimated to be below 5%. Adapted from ref. , Elsevier.
Extended Data Fig. 1
Extended Data Fig. 1. Cryo-ET and subtomogram averaging.
(a) Sample preparation for cryo-ET. E. coli cells were vitrified, thinned by cryo focussed ion beam (FIB) milling and tomograms aquired in a cryo-transmission electron microscope (TEM). Representative scanning electron micrograph of a sample before and after FIB milling is shown along with an overview of a lamella from a cryo-TEM (a total of 166 tomograms were acquired for 37 °C, HS and MetK combined). (b) Processing flowchart used for EL–ES1 and EL–ES2 subtomogram averaging in situ. The color of the box indicates whether the respective step was performed in STOPGAP (blue) or with the indicated program (white). See Methods for details.
Extended Data Fig. 2
Extended Data Fig. 2. In situ structural analysis of 70 S ribosomes.
(a-b) Subtomogram averaging of ribosomes. Ribosomes from three datasets (37 °C, HS, MetK) were averaged and refined to a global resolution of 8.7 Å. The resulting subtomogram structure with the superposed molecular model (PDB code 4V4A) in ribbon representation (a) and the corresponding FSC curve (b) are shown. (c) Analysis of ribosome to GroEL 14-mer ratio in tomograms (box plots; 37 °C n = 48, HS n = 58, MetK n = 60 tomograms) and by MS using intensity-based absolute quantification (iBAQ) (blue crosses; n = 3 independent experiments). Box plots show median (center line), interquartile range (IQR) (box edges) and 1.5 × IQR (whiskers). The MS measurements fall mainly within the range of the first to third quartile of the tomography data, indicating that most EL complexes were identified in situ. Source data
Extended Data Fig. 3
Extended Data Fig. 3. Biochemical analysis of GroEL/GroES levels and MetK binding.
(a) Representative immunoblot of GroEL and GroES for the different growth conditions analyzed (37 °C, HS, MetK and EL+). Glyceraldehyde-3-phosphate dehydrogenase (GAPDH) was used as loading control. (b) Quantification of GroEL and GroES levels by label-free mass spectrometry of cell lysates. The total amount of GroEL was quantified by label-free mass spectrometry using iBAQ. iBAQ values of GroEL and GroES of cells grown at 37 °C cells were set to 1 and used for normalization (n = 3 independent experiments). The horizontal line in the boxplots indicates the median value; boxes indicate upper and lower quartile and whisker caps the largest or smallest value within 1.5 times the interquartile range above the 75th percentile or below the 25th percentile, respectively. (c) Ratio of GroEL 14-mer and GroES 7-mer, based on the iBAQ values from (b). The GroEL:GroES ratio in wild-type cells at 37 °C was set to 1 and used for normalization. The differences between the groups were not statistically significant when compared with a 1-way ANOVA test. (d) Growth of E. coli BL21(DE3) at 37 °C, upon exposure to HS at 46 °C or upon ~4,5-fold overexpression of GroEL (EL+) at 37 °C. Data points are averages ± SD (n = 3, independent repeats). Growth curves were standardized to start at a log2(OD600) value of 0. (e) Growth of transformed E. coli BL21(DE3) at 37 °C, upon sequential overexpression of GroEL/GroES and MetK (MetK cells) or upon ~4,5-fold overexpression of GroEL with subsequent overexpression of MetK (EL+/MetK) at 37 °C (see Methods). For comparison, the growth of the latter strain without induction (n.i.) of MetK (EL+/MetK(n.i.)) is shown. Data points are averages ± SD (n = 3, independent repeats). Growth curves were standardized to start at a log2(OD600) value of 0. (f) Quantification of MetK bound to GroEL complexes in 37 °C and MetK overexpressing cells. Apyrase treatment was performed upon cell lysis to stop GroEL cycling. GroEL was immunoprecipitated (IP), followed by immunoblotting with antibodies against GroEL and MetK. Anti-lactalbumin antibodies were used as non-specific control. (g) Quantification of MetK:GroEL stoichiometry by MS in GroEL IPs from (d). The fraction of MetK per GroEL 14-mer was calculated based on iBAQ values (n = 3 independent experiments). Box plots show median (center line), interquartile range (IQR) (box edges) and 1.5 × IQR (whiskers). (h) Cellular abundance of GroEL in 37 °C and EL+ cells. The data was normalized to a median of 1 for 37 °C (n = 3 independent experiments). Boxplots are defined as in (g). (i) Cellular abundance of EL–ES1 in 37 °C and EL+ cells. The abundance of EL–ES1 relative to ribosomes in tomograms was calculated as a proxy for its cytosolic concentration and normalized to a median of 1 for 37°C. Source data
Extended Data Fig. 4
Extended Data Fig. 4. In situ structural analysis of GroEL complexes.
(a-d) FSC curves for EL–ES1 narrow (a), EL–ES1 wide (b) and EL–ES2 complexes (c), as well as EL (d) from Fig. 2a–d. The resolution at the 0.143 FSC cut-off is indicated. Note that free GroEL (EL) was only observed upon GroEL overexpression (EL+) and thus this structure was obtained from a separate data set. (e) Comparison of GroEL subunits in the trans-ring of the in situ structure of EL–ES1 narrow (dark blue) and the crystal structure of GroEL·ADP7–GroES7 (yellow) (PDB 1AON). Two orthogonal views of the superimposed models are shown. The models are depicted in ribbon representation. (f) Comparison of GroEL subunits in the trans-ring of the in situ structure of EL–ES1 wide (light blue) and the cryoEM structure of EL–ES1 in complex with 14 ADP molecules (orange) (PDB 7PBJ), using the same representation as in (e). (g) Distribution of narrow and wide EL–ES1 complexes at 37 °C, upon overexpression of GroEL, GroES and MetK at 37 °C (MetK cells) or upon exposure to HS at 46 °C (37 °C, n = 48; MetK, n = 60; HS, n = 58 tomograms). (h) Comparison of GroEL–GroES units of the in situ structure of EL–ES2 (orange) and the crystal structure of EL–ES2 in complex with 14 ADP·BeFx ligands (teal) (PDB 4PKO). The models are depicted in ribbon representation. (i) Overlay of the rings in the wide conformation in the in situ structures of EL–ES1 (teal) and the EL complex (yellow). The models are depicted in ribbon representation. (j) Cross section through the EL complex density. Additional density not accounted for by the molecular model is present in the more narrow ring at the SP binding sites, as shown in side and top view. There is no additional density at the given contour level in the opposing ring in the wide conformation. (k) Processing workflow of tomograms for analysis of encapsulated SP. To discern the SP states in GroEL–GroES chambers of EL–ES1 and EL–ES2 complexes, isolated chambers were aligned. After denoising the resulting subtomograms, initial structures for subsequent 3D classification were produced by bootstrapping and k means clustering. The resulting averages were used as starting structures for 3D classification (see Methods). Source data
Extended Data Fig. 5
Extended Data Fig. 5. Preparation and cryo-EM analysis of the GroEL–GroES–MetK complex.
(a-b) Size exclusion chromatography of the stable GroEL–GroES–MetK complex prepared in the presence of ATP·BeFx (see Material and Methods). A representative chromatogram is shown in (a). Eluate fractions F1−F5 were analyzed by SDS-PAGE and Coomassie staining (b). Purified GroEL, MetK and GroES were analyzed for comparison. Fractions F1 and F2 contain the GroEL:ES-encapsulated MetK. (c) The complex was analyzed by MS and the ratio of MetK to the GroEL 14-mer calculated based on iBAQ values (n = 2 independent samples, each 3 technical repeats). Box plots show median (center line), interquartile range (IQR) (box edges) and 1.5 × IQR (whiskers). (d) Data processing workflow for single particle analysis of GroEL–GroES–MetK complexes. A flow diagram is shown. The color of the box borders indicate that the respective step was performed in CryoSPARC (green), RELION 3.1.3 (blue) or with the indicated program (black). After data collection, particle picking and initial 2D classification (I), EL–ES1 and EL–ES2 complexes were processed separately (II). GroEL–GroES chambers were extracted and combined for further processing. Subsequently, the GroEL–GroES density was subtracted and the chamber interiors separated by 3D classification without alignment (III). The picture row shows central slices of the resulting 3D class averages, which were used to separate folded MetK from disordered MetK or empty chambers (IV). Red arrows mark the MetK densities differing by 2π/7 rotation in the GroEL–GroES chambers. The other 3D class averages had no visible secondary structure elements. The GroEL–GroES–MetK chambers containing folded MetK were aligned and refined to a resolution of 3.0 Å. Local refinement of MetK after signal subtraction resulted in a 3.7 Å resolution map. The final resolution for GroEL–GroES chambers with disordered MetK or empty chambers was 2.9 Å. See Methods for details. Source data
Extended Data Fig. 6
Extended Data Fig. 6. Single particle analysis of GroEL–GroES–MetK complexes.
(a) A representative micrograph of the GroEL–GroES–MetK sample at a magnification of 22,500-fold. (8,945 micrographs were used after on-the-fly preselection) (b) Corresponding 2D classes of particles selected for further refinement. (c, d) Surface representation of densities for MetK-containing EL–ES2 (c) and EL–ES1 (narrow conformation) complexes (d). The red boxes indicate the GroEL–GroES chambers that were processed further to solve the GroEL–GroES–MetK complex structure. (e, f) Bottom views of the densities and molecular models for the apical domains of the trans-ring in EL–ES1 complexes with wide (e) and narrow (f) conformation. Surface views of the density are shown. The models are depicted in ribbon representation, with the substrate binding helices αH and αI highlighted in orange and yellow, respectively. Additional density in the narrow trans-ring not accounted for by the model – presumably from the substrate MetK – is high-lighted in teal (f). The insert shows one apical domain of the narrow trans-ring in detail.
Extended Data Fig. 7
Extended Data Fig. 7. Resolution and density fit analysis of GroEL–GroES chambers and MetK.
(a-d) FSC curves (top) and local resolution maps (bottom) of the empty GroEL–GroES chamber (a), the GroEL–GroES chamber with disordered MetK or without substrate (b), the GroEL–GroES chamber with ordered MetK (c) and isolated MetK (d), respectively. The rainbow color gradient indicates the local resolution scale. (e, f) Cryo-EM density of MetK with superposed molecular model in ribbon representation. Two views for the entire protein are shown (e). Exemplary portions of the structure are shown below with side chains in stick representation (f). The respective residue ranges are indicated. (g) Angular sampling of MetK. Planar and spherical representation of the Fourier sampling of MetK depicted in (d). The color gradient from dark blue to pale yellow corresponds to the number of images in each bin. The sampling compensation factor was calculated to be 0.987 with values over 0.81, generally indicating adequate sampling,. Image was generated using the CryoSPARC Orientation Diagnostics job76.
Extended Data Fig. 8
Extended Data Fig. 8. Comparison of isolated tetrameric MetK with GroEL–GroES-encapsulated MetK and the effect of MetK encapsulation on GroEL–GroES chambers.
(a) Overview of the crystal structure of the MetK tetramer (left; PDB 7LOO). One subunit is shown in ribbon representation in gold, the other three as molecular surfaces in violet, blue and yellow, respectively. The insert highlights the location of the core loop, which is marked by a red asterisk. Bound ligands pyrophosphate and S-adenosylmethionine are shown as stick models in green. Cut-away view of GroEL–GroES encapsulated, folded MetK in the GroEL–GroES chamber in the same orientation (right). MetK is shown in ribbon representation (teal). The GroEL and GroES subunits are shown as molecular surfaces. The core loop of MetK is indicated by a red asterisk, and the last resolved residue Pro525 in the GroEL subunits is indicated with the letter C. The disordered C-terminal GGM repeats, GroEL residues 536−548, could easily reach the exposed MetK interface regions. (b-d) Overlay of the C7-symmetric model of the empty GroEL–GroES chamber (green) with the chamber containing either disordered MetK or no substrate (blue) at the level of the equatorial GroEL domains (b), the intermediate domains and the hinge regions between equatorial and intermediate domains (c and d). (e-g) Overlay of the C7-symmetric model of the empty GroEL–GroES chamber (green) with the chamber containing folded MetK (purple) at the level of the equatorial GroEL domains (e), the intermediate domains and the hinge regions between equatorial and intermediate domains (f and g).
Extended Data Fig. 9
Extended Data Fig. 9. Analysis of the SP density in GroEL–GroES chamber subtomograms.
Central xy slices of the subtomogram averages of in vitro assembled GroEL–GroES chambers with ordered MetK (left) and class I in situ chambers (containing structured substrate; see Fig. 3b) from cells overexpressing GroEL/GroES and MetK (right), with gray values normalized to 2 standard deviations. The center of mass for the density within a spherical volume in the chamber indicated by a circle is depicted by a red asterisk. Within error, the centers of mass were identical (x, y, z in voxels: 65, 65, 51).

Similar articles

Cited by

References

    1. Hayer-Hartl, M., Bracher, A. & Hartl, F. U. The GroEL–GroES chaperonin machine: a nano-cage for protein folding. Trends Biochem. Sci. 41, 62–76 (2016). 10.1016/j.tibs.2015.07.009 - DOI - PubMed
    1. Horwich, A. L. & Fenton, W. A. Chaperonin-assisted protein folding: a chronologue. Q. Rev. Biophys.53, e4 (2020). 10.1017/S0033583519000143 - DOI - PubMed
    1. Gestaut, D., Limatola, A., Joachimiak, L. & Frydman, J. The ATP-powered gymnastics of TRiC/CCT: an asymmetric protein folding machine with a symmetric origin story. Curr. Opin. Struct. Biol.55, 50–58 (2019). 10.1016/j.sbi.2019.03.002 - DOI - PMC - PubMed
    1. Brinker, A. et al. Dual function of protein confinement in chaperonin-assisted protein folding. Cell107, 223–233 (2001). 10.1016/S0092-8674(01)00517-7 - DOI - PubMed
    1. Mayhew, M. et al. Protein folding in the central cavity of the GroEL–GroES chaperonin complex. Nature379, 420–426 (1996). 10.1038/379420a0 - DOI - PubMed

MeSH terms

LinkOut - more resources