

Machine learning-based reproducible prediction of type 2 diabetes subtypes
- PMID: 39168869
- PMCID: PMC11519166
- DOI: 10.1007/s00125-024-06248-8
Machine learning-based reproducible prediction of type 2 diabetes subtypes
Abstract
Aims/hypothesis: Clustering-based subclassification of type 2 diabetes, which reflects pathophysiology and genetic predisposition, is a promising approach for providing personalised and effective therapeutic strategies. Ahlqvist's classification is currently the most vigorously validated method because of its superior ability to predict diabetes complications but it does not have strong consistency over time and requires HOMA2 indices, which are not routinely available in clinical practice and standard cohort studies. We developed a machine learning (ML) model to classify individuals with type 2 diabetes into Ahlqvist's subtypes consistently over time.
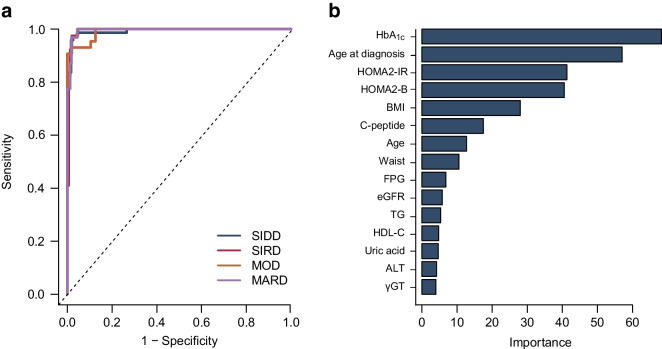
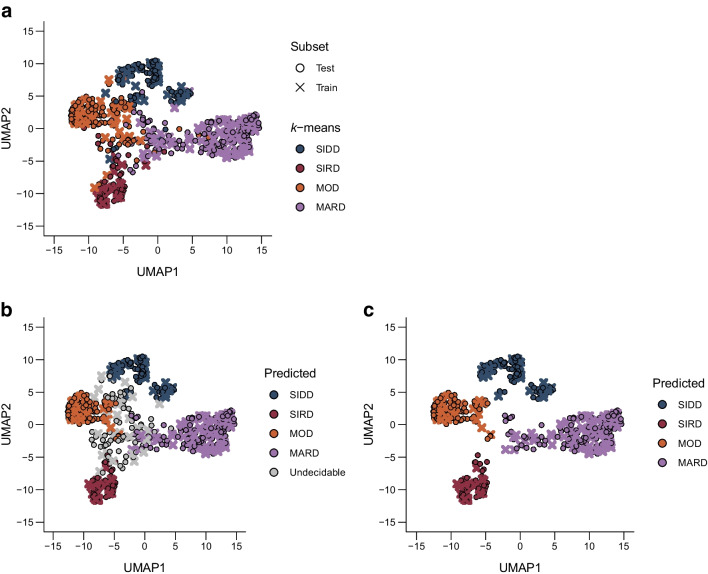
Methods: Cohort 1 dataset comprised 619 Japanese individuals with type 2 diabetes who were divided into training and test sets for ML models in a 7:3 ratio. Cohort 2 dataset, comprising 597 individuals with type 2 diabetes, was used for external validation. Participants were pre-labelled (T2Dkmeans) by unsupervised k-means clustering based on Ahlqvist's variables (age at diagnosis, BMI, HbA1c, HOMA2-B and HOMA2-IR) to four subtypes: severe insulin-deficient diabetes (SIDD), severe insulin-resistant diabetes (SIRD), mild obesity-related diabetes (MOD) and mild age-related diabetes (MARD). We adopted 15 variables for a multiclass classification random forest (RF) algorithm to predict type 2 diabetes subtypes (T2DRF15). The proximity matrix computed by RF was visualised using a uniform manifold approximation and projection. Finally, we used a putative subset with missing insulin-related variables to test the predictive performance of the validation cohort, consistency of subtypes over time and prediction ability of diabetes complications.
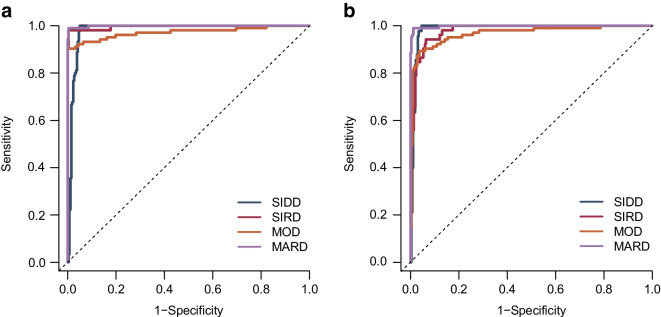
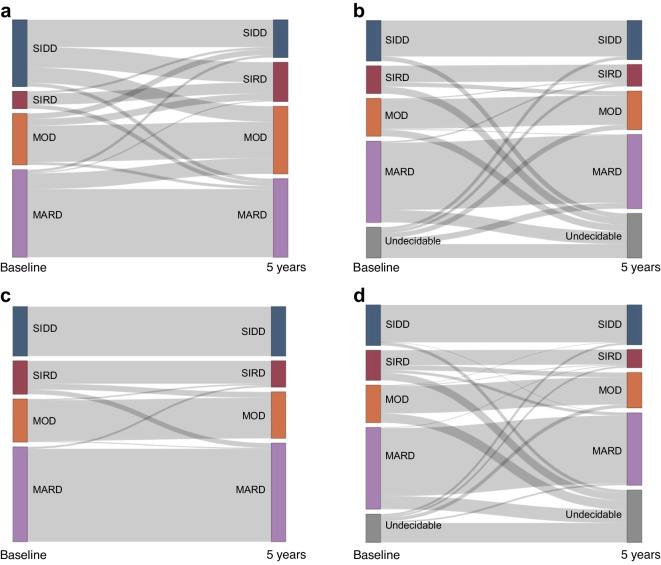
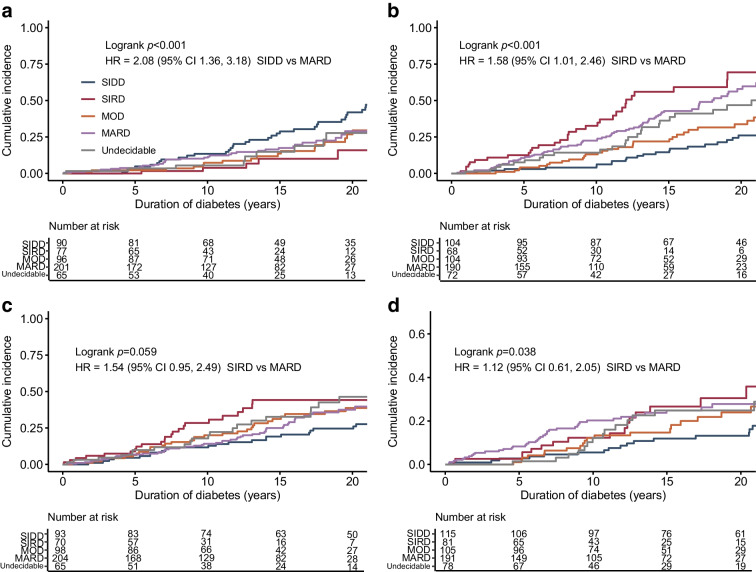
Results: T2DRF15 demonstrated a 94% accuracy for predicting T2Dkmeans type 2 diabetes subtypes (AUCs ≥0.99 and F1 score [an indicator calculated by harmonic mean from precision and recall] ≥0.9) and retained the predictive performance in the external validation cohort (86.3%). T2DRF15 showed an accuracy of 82.9% for detecting T2Dkmeans, also in a putative subset with missing insulin-related variables, when used with an imputation algorithm. In Kaplan-Meier analysis, the diabetes clusters of T2DRF15 demonstrated distinct accumulation risks of diabetic retinopathy in SIDD and that of chronic kidney disease in SIRD during a median observation period of 11.6 (4.5-18.3) years, similarly to the subtypes using T2Dkmeans. The predictive accuracy was improved after excluding individuals with low predictive probability, who were categorised as an 'undecidable' cluster. T2DRF15, after excluding undecidable individuals, showed higher consistency (100% for SIDD, 68.6% for SIRD, 94.4% for MOD and 97.9% for MARD) than T2Dkmeans.
Conclusions/interpretation: The new ML model for predicting Ahlqvist's subtypes of type 2 diabetes has great potential for application in clinical practice and cohort studies because it can classify individuals with missing HOMA2 indices and predict glycaemic control, diabetic complications and treatment outcomes with long-term consistency by using readily available variables. Future studies are needed to assess whether our approach is applicable to research and/or clinical practice in multiethnic populations.
Keywords: Clustering; Diabetes subtypes; Machine learning; Random forest; Type 2 diabetes.
© 2024. The Author(s).
Figures
Similar articles
-
Replication and cross-validation of type 2 diabetes subtypes based on clinical variables: an IMI-RHAPSODY study.Diabetologia. 2021 Sep;64(9):1982-1989. doi: 10.1007/s00125-021-05490-8. Epub 2021 Jun 10. Diabetologia. 2021. PMID: 34110439 Free PMC article.
-
Assessing reproducibility and utility of clustering of patients with type 2 diabetes and established CV disease (SAVOR -TIMI 53 trial).PLoS One. 2021 Nov 19;16(11):e0259372. doi: 10.1371/journal.pone.0259372. eCollection 2021. PLoS One. 2021. PMID: 34797832 Free PMC article.
-
Clinical application of cluster analysis in patients with newly diagnosed type 2 diabetes.Hormones (Athens). 2024 Sep 4. doi: 10.1007/s42000-024-00593-4. Online ahead of print. Hormones (Athens). 2024. PMID: 39230795
-
Type 2 diabetes classification: a data-driven cluster study of the Danish Centre for Strategic Research in Type 2 Diabetes (DD2) cohort.BMJ Open Diabetes Res Care. 2022 Apr;10(2):e002731. doi: 10.1136/bmjdrc-2021-002731. BMJ Open Diabetes Res Care. 2022. PMID: 35428673 Free PMC article.
-
Risk of diabetes-associated diseases in subgroups of patients with recent-onset diabetes: a 5-year follow-up study.Lancet Diabetes Endocrinol. 2019 Sep;7(9):684-694. doi: 10.1016/S2213-8587(19)30187-1. Epub 2019 Jul 22. Lancet Diabetes Endocrinol. 2019. PMID: 31345776
References
-
- Inzucchi SE, Bergenstal RM, Buse JB et al (2012) Management of hyperglycemia in type 2 diabetes: a patient-centered approach: position statement of the American Diabetes Association (ADA) and the European Association for the Study of Diabetes (EASD). Diabetes Care 35(6):1364–1379. 10.2337/dc12-0413 - PMC - PubMed
MeSH terms
Substances
Grants and funding
- grant numbers 23K15397 to HT/Japan Society for the Promotion of Science (JPSP)
- 22K11729 to MS/Japan Society for the Promotion of Science (JPSP)
- Moonshot R&D Program grant number JPMJMS2023 to HK/Japan Science and Technology Agency (JST)
- grant number JPMJPF2301 to EK/Japan Science and Technology Agency (JST)
LinkOut - more resources
Full Text Sources
Medical
Miscellaneous
