. 2024 Sep 17;9(9):e0079424.
doi: 10.1128/msystems.00794-24. Epub 2024 Aug 21.

Gut dysbiosis contributes to the development of Budd-Chiari syndrome through immune imbalance

Affiliations

Gut dysbiosis contributes to the development of Budd-Chiari syndrome through immune imbalance

Qinwei Lu et al. mSystems. .

Abstract

Budd-Chiari syndrome (B-CS) is a rare and lethal condition characterized by hepatic venous outflow tract blockage. Gut microbiota has been linked to numerous hepatic disorders, but its significance in B-CS pathogenesis is uncertain. First, we performed a case-control study (Ncase = 140, Ncontrol = 63) to compare the fecal microbiota of B-CS and healthy individuals by metagenomics sequencing. B-CS patients' gut microbial composition and activity changed significantly, with a different metagenomic makeup, increased potentially pathogenic bacteria, including Prevotella, and disease-linked microbial function. Imbalanced cytokines in patients were demonstrated to be associated with gut dysbiosis, which led us to suspect that B-CS is associated with gut microbiota and immune dysregulation. Next, 16S ribosomal DNA sequencing on fecal microbiota transplantation (FMT) mice models examined the link between gut dysbiosis and B-CS. FMT models showed damaged liver tissues, posterior inferior vena cava, and increased Prevotella in the disturbed gut microbiota of FMT mice. Notably, B-CS-FMT impaired the morphological structure of colonic tissues and increased intestinal permeability. Furthermore, a significant increase of the same cytokines (IL-5, IL-6, IL-9, IL-10, IL-17A, IL-17F, and IL-13) and endotoxin levels in B-CS-FMT mice were observed. Our study suggested that gut microbial dysbiosis may cause B-CS through immunological dysregulation.

Importance: This study revealed that gut microbial dysbiosis may cause Budd-Chiari syndrome (B-CS). Gut dysbiosis enhanced intestinal permeability, and toxic metabolites and imbalanced cytokines activated the immune system. Consequently, the escalation of causative factors led to their concentration in the portal vein, thereby compromising both the liver parenchyma and outflow tract. Therefore, we proposed that gut microbial dysbiosis induced immune imbalance by chronic systemic inflammation, which contributed to the B-CS development. Furthermore, Prevotella may mediate inflammation development and immune imbalance, showing potential in B-CS pathogenesis.

Keywords: Budd-Chiari syndrome; fecal microbiota transplantation; gut microbiota; gut microbiota dysbiosis; immune imbalance.


Conflict of interest statement

The authors declare no conflict of interest.

Figures

Fig 1
Fig 1
Dysbiosis of gut microbiota patterns in patients with B-CS and controls. (A) The boxplot shows the community richness and Shannon index at the genus level. (B) The boxplot shows the community richness and Shannon index at the species level. (C) PCoA based on the relative abundance of cases and controls in 203 samples. (D) The boxplot shows the relative abundance of 10 bacteria enriched in the control group at the phylum level. (E) The boxplot shows the relative abundance of five genera enriched in B-CS patients and 26 genera abundant in control. (F) The boxplot shows the relative abundance of two bacteria enriched in B-CS patients and 34 bacteria abundant in control at the species level. Boxes represent the interquartile ranges, and lines inside the boxes denote medians.
Fig 2
Fig 2
Functional alteration in gut microbiota of B-CS. (A) Principal coordinate analysis based on unweighted UniFrac distances revealed that the control bacterial communities clustered separately from B-CS bacterial communities. Each point represents a single sample, colored by group. The eigenvalues of axe PCoA1 and PCoA2 were 43.52% and 22.22%, respectively. (B) The boxplot shows differences in gut microbiota annotation function between the B-CS and control groups using the Kyoto Encyclopedia of Genes and Genomes database. Functional pathways related to immunity are enriched in B-CS individuals.
Fig 3
Fig 3
The association of cytokine disorder and gut dysbiosis in B-CS. (A) B-CS caused significant changes in 20 cytokines (IFN-α2, IL-17F, IL-23, IL-27, IP-10, I-TAC, TSLP, MCP-1α, GM-CSF, IL-1α, IL-1β, IL-4, IL-5, IL-6, IL-8, IL-9, IL-10, IL-12p40, IL-13 and IL-17A) in human peripheral serum. (B) Serum endotoxin levels. (C) The association analysis of cytokine and gut microbiota at the phylum level. *P < 0.05, **P < 0.01, ***P < 0.001.
Fig 4
Fig 4
Administration of fecal bacteria from patients with B-CS to mice induced gut dysbiosis in mice. (A) Schematic representation of fecal microbiota transplantation (FMT), Fresh fecal from three B-CS and three healthy control donors were mixed and used as a single source for B-CS FMT and Control FMT mice, respectively. The recipient mice were randomly divided and orally inoculated daily for three consecutive days and two times per week for 6 weeks with prepared fecal contents. (B–D) ACE Index (P = 0.000000317), Chao1 index (P = 0.00000082) and Simpson index (P = 0.080) in α diversity index analysis (t-test). B-CS group significantly increased the gut microbial abundance of mice but had no effect on the microbial diversity. (E) Principal coordinate analysis based on unweighted UniFrac distances revealed that the control bacterial communities clustered separately from B-CS bacterial communities. Each circle represents a single sample, coloured by group. The eigenvalues of axe principal co-ordinates analysis (PCoA)one and PCoA2 were 44.02% and 7.373%, respectively. (F) Anosim analysis based on Bray-Curtis algorithm showed that the difference was significantly greater than the within-group difference (R-value = 0.999, P = 0.001). (G) Clustering analysis showed significant differences in the main components of gut microbiota. (H and I) The community structure component diagram demonstrates the community structure of each group at the phylum and genus level. Gut dysbiosis was transferrable by fecal transplant. According to the species annotation results, the top 10 species in the maximum abundance of each grouping were selected to generate a columnar accumulation plot of the relative abundance of species.
Fig 5
Fig 5
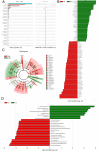
Differences in gut microbiota between control and B-CS-FMT groups. (A) Analysis of STAMP differences (t-test) at the genus level showed the abundance of species between the two groups. The left panel showed the proportion of abundance of different species in two samples or two groups of samples, the middle showed the proportion of difference within 95% CI, the rightmost value is P-value, and P value < 0.05 indicates significant difference. (B) linear discriminant analysis (LDA) effect size identified the most differentially abundant taxa between the two groups. Only taxa meeting an LDA significant threshold of >2 are shown. (C) Differential species evolutionary cladogram recognized the specific bacteria associated with B-CS. (D) The results of LefSe analysis based on KEGG functional prediction, including histograms of LDA value distribution and functional items with statistical differences in different abundance comparison plots.
Fig 6
Fig 6
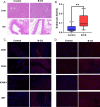
Fecal microbiota transplanted from the patients with B-CS affected hepatic and IVC function in recipient mice. (A) Representative H&E staining of the liver and IVC of mice. Original magnification, ×200. (B) Serum endotoxin levels. *P < 0.05, **P < 0.01 (C) Representative image of CD31, CD34, ICAM-1 and vWF immunofluorescence staining in IVC tissues of post-hepatic segment (original magnification, ×400). (D) Representative image of CD31, CD34, ICAM-1 and vWF immunofluorescence staining in liver tissues (original magnification, ×400).
Fig 7
Fig 7
CS-FMT impaired intestinal barrier and imbalanced cytokines of mice. (A) Histological examination of colon. The sections were stained with H&E. Original magnification, ×200. (B) Immunohistochemistry determination of ZO-1 and Occludin expression in the colon tissue of mice. Original magnification, ×200. (C) Immunofluorescent analysis of ZO-1 and Occludin in the colon tissue of mice. Original magnification, ×200. (D) A total of 7 cytokines (IL-5, IL-6, IL-9, IL-10, IL-17A, IL-17F and IL-13) were found to be significantly altered in the peripheral serum of B-CS-FMT mice. *P < 0.05, **P < 0.01, ***P < 0.001.

Similar articles

References

    1. Northup PG, Garcia-Pagan JC, Garcia-Tsao G, Intagliata NM, Superina RA, Roberts LN, Lisman T, Valla DC. 2021. Vascular liver disorders, portal vein thrombosis, and procedural bleeding in patients with liver disease: 2020 practice guidance by the American association for the study of liver diseases. Hepatology 73:366–413. doi:10.1002/hep.31646 - DOI - PubMed
    1. Janssen HLA, Garcia-Pagan J-C, Elias E, Mentha G, Hadengue A, Valla D-C, European Group for the Study of Vascular Disorders of the Liver . 2003. Budd-Chiari syndrome: a review by an expert panel. J Hepatol 38:364–371. doi:10.1016/s0168-8278(02)00434-8 - DOI - PubMed
    1. Valla DC. 2018. Budd-Chiari syndrome/hepatic venous outflow tract obstruction. Hepatol Int 12:168–180. doi:10.1007/s12072-017-9810-5 - DOI - PubMed
    1. Qi X, Guo X, Fan D. 2015. Difference in Budd-Chiari syndrome between the West and China. Hepatology 62:656. doi:10.1002/hep.27628 - DOI - PubMed
    1. Yang B, Qu D, Zhao A-L, Li Y, Meng R-R, Yu J-X, Gao P, Lin HP. 2017. Identification of differentially expressed genes in Budd‑Chiari syndrome by RNA‑sequencing. Mol Med Rep 16:8011–8018. doi:10.3892/mmr.2017.7621 - DOI - PMC - PubMed

LinkOut - more resources