. 2024 Aug 27;43(8):114640.
doi: 10.1016/j.celrep.2024.114640. Epub 2024 Aug 21.

CRISPR screening uncovers a long-range enhancer for ONECUT1 in pancreatic differentiation and links a diabetes risk variant

Affiliations

CRISPR screening uncovers a long-range enhancer for ONECUT1 in pancreatic differentiation and links a diabetes risk variant

Samuel Joseph Kaplan et al. Cell Rep. .

Abstract

Functional enhancer annotation is critical for understanding tissue-specific transcriptional regulation and prioritizing disease-associated non-coding variants. However, unbiased enhancer discovery in disease-relevant contexts remains challenging. To identify enhancers pertinent to diabetes, we conducted a CRISPR interference (CRISPRi) screen in the human pluripotent stem cell (hPSC) pancreatic differentiation system. Among the enhancers identified, we focused on an enhancer we named ONECUT1e-664kb, ∼664 kb from the ONECUT1 promoter. Previous studies have linked ONECUT1 coding mutations to pancreatic hypoplasia and neonatal diabetes. We found that homozygous deletion of ONECUT1e-664kb in hPSCs leads to a near-complete loss of ONECUT1 expression and impaired pancreatic differentiation. ONECUT1e-664kb contains a type 2 diabetes-associated variant (rs528350911) disrupting a GATA motif. Introducing the risk variant into hPSCs reduced binding of key pancreatic transcription factors (GATA4, GATA6, and FOXA2), supporting its causal role in diabetes. This work highlights the utility of unbiased enhancer discovery in disease-relevant settings for understanding monogenic and complex disease.

Keywords: CP: Developmental biology; CP: Molecular biology; CRISPRi screen; ONECUT1; T2D; VUS; enhancer; neonatal diabetes; non-coding variant; pancreas development; type 2 diabetes; variant of uncertain significance.


Conflict of interest statement

Declaration of interests The authors declare no competing interests.

Figures
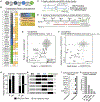
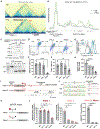
Figure 1.
Figure 1.. CRISPRi repression screen to discover pancreatic differentiation enhancers
(A) hPSC stepwise pancreatic differentiation protocol schematic. ActA, Activin A; CHIR, CHIR99021; RA, retinoic acid; VitC, vitamin C. (B) Gene selection rationale for the enhancer discovery screen. (C) Putative enhancer region selection and gRNA design schematic. (D) Screening procedure schematic. (E) Results from two screen replicates; each point represents a genomic region. Highlighted are 38 regions with false discovery rate < 0.15 in replicate 2 that have a decrease in PDX1 in both replicates. (F) Results from screen replicate 2 compared to the whole-genome PDX1 expression differentiation screen. Genes showing enrichment in both screens are labeled. (G) Region overlap with H3K27ac peaks at any stage during differentiation (ES, DE, GT, and PFG). (H) Differentiation stages at which non-promoter screen hits overlap with H3K27ac peaks and the number of hits with each activation pattern. (I) Enhancer-gene pair assignment. (J) Enhancer-gene pair linear distances.
Figure 2.
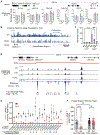
Figure 2.. ONECUT1e-664kb deletion and pancreatic differentiation characterization
(A) Hi-C data of DE- and PFG-stage differentiated hPSCs around the ONECUT1 locus. Contact between ONECUT1e-664kb and ONECUT1 promoter regions is circled to highlight the increase in contact frequency between the two loci. Red lines demarcate TAD boundaries identified at 50 kb. (B) 1D slices of the 2D contact map were obtained with the ONECUT1 promoter set as the bin of origin. Hi-C data were library scaled and show the changes observed in (A). Significantly different bins were determined by DESeq2. (C) hPSC enhancer deletion and genotyping PCR schematic. (D) Representative flow cytometry plots of WT and eKO cells differentiated to the PFG stage. (E) Percentage of cells achieving a ONECUT1+ identity. (F) Percentage of cells achieving a PDX1+ identity. (G) Representative histograms of ONECUT1 MFI of PDX1+ cells from flow cytometry of unedited and eKO cells differentiated to the PFG stage. (H) Quantification and statistical comparison of ONECUT1 MFI of PDX1+ cells. (I) Schematic for identifying ddPCR SNPs and genotyping SNPs. (J) Spectrogram of genotyping SNP amplicon sequencing and schematic showing the allele that contained the deletion in heterozygous lines. (K) ddPCR assay design schematic. (L) Allele-specific ONECUT1 transcript quantification with ddPCR on RNA extracted from PFG-stage cells. Each allele is shown in a separate plot, with the expression ratio shown in the last plot. Each symbol represents one independent differentiation (n = 3 independent experiments) with two averaged technical ddPCR replicates. Data are presented as the mean ± SD. One-way analysis of variance (ANOVA) followed by Dunnett multiple comparisons test versus WT control. For (E), (F), and (H), each dot represents one independent experiment (n = 4 or 5 independent experiments, 4 for Het. 1), and data are presented as the mean ± SD. For all panels, ns p > 0.05, * p ≤ 0.05, ** p ≤ 0.01, *** p ≤ 0.001, **** p ≤ 0.0001.
Figure 3.
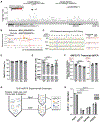
Figure 3.. Transcriptional and epigenetic consequences of ONECUT1e-664kb KO
(A) RNA-seq normalized read counts for genes in the ONECUT1 locus at GT and PFG stages from WT, heterozygous (het. 2), and homozygous eKO hPSCs. * Padj < 0.005 computed by DESeq2. (B) Visualization of antisense RNA relative to the direction of ONECUT1 and read coverage from strand-specific RNA-seq of PFG-stage WT and homozygous eKO cells of representative differentiation replicates. (C) Quantification of (B). Each dot represents one independent experiment (n = 3 independent experiments). One-way ANOVA followed by Dunnett multiple-comparisons test versus WT control. (D) H3K27ac ChIP-seq at the PFG stage of WT, heterozygous, and homozygous eKO cells. TADs were called from PFG-stage Hi-C data. Difference was calculated via MACS2 subtract. Top differential peaks between WT and homozygous eKO cells were quantified with DESeq2. The ONECUT1e-664kb deletion region is within peak #12. (E) H3K27ac is decreased in an allele-specific manner within significantly affected H3K27ac peaks. (F) Quantification of average H3K27ac read ratios at all heterozygous SNP positions in the phased locus in the top significantly different peaks (WT vs. Homo, padj < 1E–15) and other peaks. Each point represents a heterozygous SNP position; average of three replicates from independent experiments. Ordinary one-way ANOVA with Šidák’s multiple-comparisons test with a single pooled variance. Data are presented as mean ± SD for (A), (C), (E), and (F). For all panels except (A), ns p > 0.05, * p ≤ 0.05, ** p ≤ 0.01, *** p ≤ 0.001, **** p ≤ 0.0001.
Figure 4.
Figure 4.. T2D-associated SNP hPSC modeling and pancreatic differentiation characterization
(A) LocusZoom plot of variants from the Mahajan et al. T2D GWAS meta-analysis unadjusted for BMI. Variants within credible sets are colored by the PPA score. (B) Decreased DeepLift attribution score at the GATA motif upon introduction of the variant. The red box represents a GATA6 binding motif hit by FIMO (P < 0.001). (C) Spectrogram of disease-associated SNP amplicon sequencing and schematic showing the allele that contains the introduced SNP in hPSCs. (D) Percentage of ONECUT1+ cells at the PFG stage. (E) Statistical comparison of ONECUT1 MFI of PDX1+ cells. (F) ONECUT1 transcript ratio of edited alleles divided by unedited alleles. For each independent experiment shown, there were two averaged technical ddPCR replicates. (G) ChIP-ddPCR schematic. (H) ChIPed DNA ratio analysis. Each symbol represents one independent differentiation and ChIP experiment; two averaged technical ddPCR replicates ± SD. Two-way ANOVA followed by Tukey’s multiple-comparisons test versus WT control. For (D)–(F), each symbol represents one independent experiment (n = 6 independent experiments), and data are presented as the mean ± SD. One-way ANOVA followed by Dunnett multiple-comparisons test versus WT control. For all panels, ns p > 0.05, * p ≤ 0.05, ** p ≤ 0.01, *** p ≤ 0.001, **** p ≤ 0.0001.

Update of

Similar articles

References

    1. Katsanis N. (2016). The continuum of causality in human genetic disorders. Genome Biol. 17, 233. 10.1186/s13059-016-1107-9. - DOI - PMC - PubMed
    1. Lemelman MB, Letourneau L, and Greeley SAW (2018). Neonatal Diabetes Mellitus: An Update on Diagnosis and Management. Clin. Perinatol 45, 41–59. - PMC - PubMed
    1. Croucha DJM, and Bodmer WF (2020). Polygenic inheritance, GWAS, polygenic risk scores, and the search for functional variants. Proceedings of the National Academy of Sciences of the United States of America 117, 18924–18933. - PMC - PubMed
    1. Zhang F, and Lupski JR (2015). Non-coding genetic variants in human disease. Hum. Mol. Genet 24, R102–R110. - PMC - PubMed
    1. Edwards SL, Beesley J, French JD, and Dunning M (2013). Beyond GWASs: Illuminating the dark road from association to function. Am. J. Hum. Genet 93, 779–797. - PMC - PubMed

MeSH terms

Substances

LinkOut - more resources