. 2024 Aug 15;13(8):bio060615.
doi: 10.1242/bio.060615. Epub 2024 Aug 19.

Modeling the roles of cohesotaxis, cell-intercalation, and tissue geometry in collective cell migration of Xenopus mesendoderm

Affiliations

Modeling the roles of cohesotaxis, cell-intercalation, and tissue geometry in collective cell migration of Xenopus mesendoderm

Tien Comlekoglu et al. Biol Open. .

Abstract

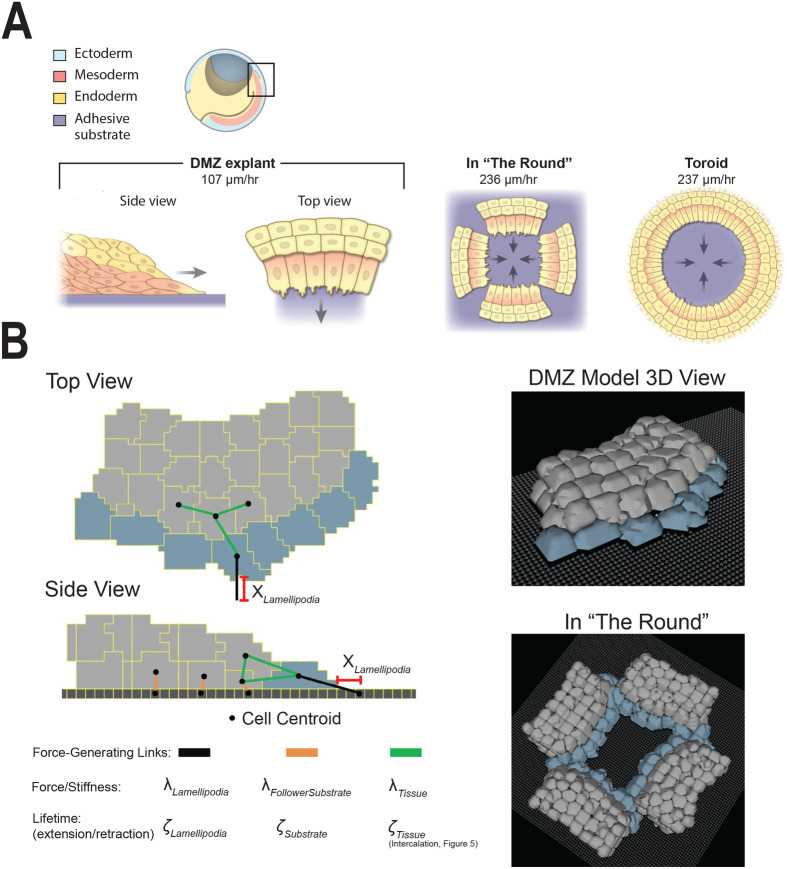
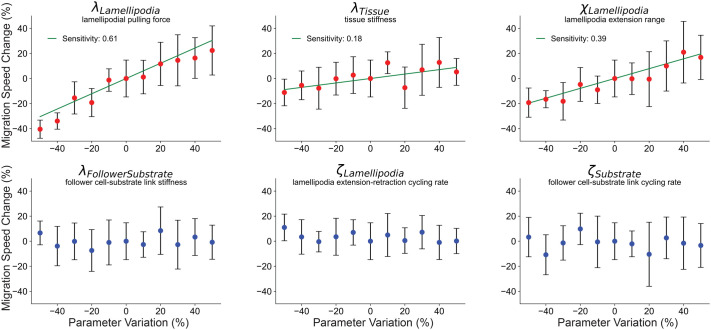
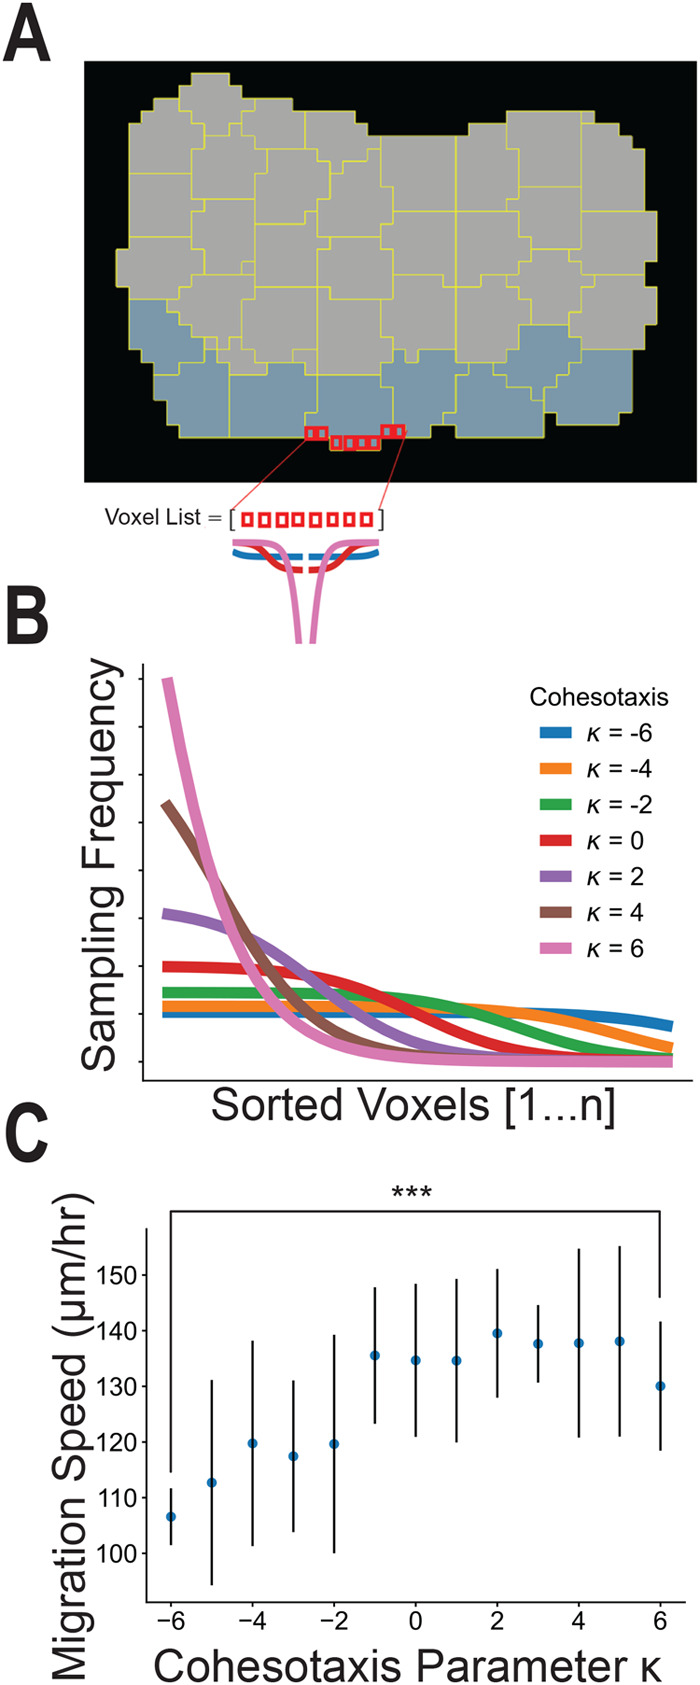
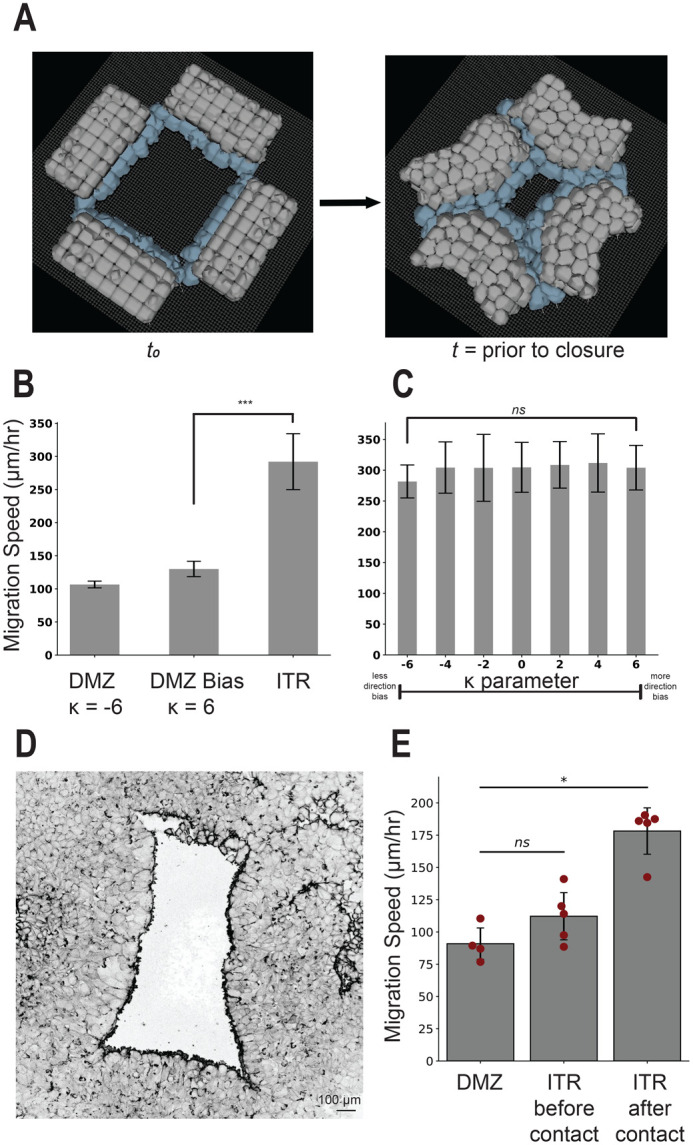
Collectively migrating Xenopus mesendoderm cells are arranged into leader and follower rows with distinct adhesive properties and protrusive behaviors. In vivo, leading row mesendoderm cells extend polarized protrusions and migrate along a fibronectin matrix assembled by blastocoel roof cells. Traction stresses generated at the leading row result in the pulling forward of attached follower row cells. Mesendoderm explants removed from embryos provide an experimentally tractable system for characterizing collective cell movements and behaviors, yet the cellular mechanisms responsible for this mode of migration remain elusive. We introduce a novel agent-based computational model of migrating mesendoderm in the Cellular-Potts computational framework to investigate the respective contributions of multiple parameters specific to the behaviors of leader and follower row cells. Sensitivity analyses identify cohesotaxis, tissue geometry, and cell intercalation as key parameters affecting the migration velocity of collectively migrating cells. The model predicts that cohesotaxis and tissue geometry in combination promote cooperative migration of leader cells resulting in increased migration velocity of the collective. Radial intercalation of cells towards the substrate is an additional mechanism contributing to an increase in migratory speed of the tissue. Model outcomes are validated experimentally using mesendoderm tissue explants.

Keywords: Agent-based model; CompuCell3D; Emergent property; Gastrulation; Mechanobiology; Tissue morphogenesis.


Conflict of interest statement

Competing interests The authors declare no competing or financial interests.

Figures

Fig. 1.
Fig. 1.
Modeling Xenopus mesendoderm tissue. (A) Illustration of gastrula-stage embryos and explants. Hemisected embryo at top, box indicates approximate location of dorsal marginal zone (DMZ) tissue explant dissected from the embryo and placed on an adhesive substrate; side and top views of adherent explant illustrate cellular organization of mesendoderm. Four separate DMZ explants are arranged as shown to generate the ‘in-the-round’ (ITR) geometry. The ITR approximates a single toroid or donut explant comprised of the entire mesendodermal mantle. Arrows indicate the direction of travel of the leading row cells in each preparation. Migration speeds taken from Davidson et al., 2002 are shown for each explant configuration. (B) Representative DMZ computational model images and schematic of critical parameters are shown. See Materials and Methods for the exhaustive parameter table and description of all parameters. Additional figures illustrating Xenopus laevis gastrulation and explant preparation procedures can be found in Davidson et al., 2002 and Sonavane et al., 2017.
Fig. 2.
Fig. 2.
Leading-edge parameters drive migration speed of the DMZ explant. One-dimensional sensitivity analysis of selected key parameters responsible for the migratory behavior of the explant: (lLamellipodia) lamellipodial pulling force, (lTissue) tissue stiffness, (χLamellipodia) lamellipodial extension distance, (lFollowerSubstrate) follower cell–substrate attachment stiffness, (ζLamellipodia) lamellipodial extension–retraction rate, and (ζSubstrate) follower cell–substrate attachment cycling rate. Parameter values ranged from −50% to +50% from baseline by equation reference ±% *reference, n=10, markers show means±s.d. Red markers indicate P<0.05 by one-way ANOVA. Sensitivity given as slope of linear regression line (green) through parameters identified as significant via one-way ANOVA. See Materials and Methods for additional parameter details.
Fig. 3.
Fig. 3.
Cohesotaxis increases the speed of migration. Cohesotaxis representation as a directional migratory bias for convex cells. (A) Preferential selection of voxels to establish a persistent direction of migration is described. (B) Probability of selecting from the sorted list of free voxels to produce the bias described in panel A and derived in Materials and Methods. (C) Measure of migration speed for different values of cohesotaxis parameter κ applied (n=10 per κ value, ***denotes significance at P<0.001 by independent samples t-test).
Fig. 4.
Fig. 4.
‘In-the-round’ geometry increases migration speed of the DMZ explant. ITR experiment configuration. (A) Representative images displaying model initialization at t0 and time to closure. (B) Migration speed comparison with the DMZ explant with and without bias (K=−6,6), *** indicates P<0.001 by independent samples t-test. (C) Effects of modulating the cohesotaxis parameter upon tissue migration speed in the ITR configuration, ns indicates P>0.05 by one-way ANOVA. Simulations results in panels B and C include n=10, mean±s.d. (D) Representative image from a biological ITR experiment, before time to closure. (E) Experiments comparing migration speed of a single linear DMZ explant and the explants in an ITR configuration before and after collision as performed in Davidson et al., 2002, n=4, mean±s.d., significance at P<0.05 by independent samples t-test.
Fig. 5.
Fig. 5.
Top-down intercalation increases migration speed in the DMZ explant. (A) Representative image of the ITR experiment after addition of rules to allow for passive intercalation. (B) Comparison of migration speed of closure with and without the addition of passive intercalation (n=10, mean±s.d., *** denotes significance at P<0.001 by independent samples t-test), and (C) migration speed measurements with different probabilities of cell–cell rearrangement per timestep, which correspond with likelihood of observed cell intercalation n=10, mean±s.d., for all parameterizations. Quantified number of cells (mean±s.d.) on the substrate throughout a 20 min simulated time course for all values of ζTissue for both the single DMZ and ITR in-silico configurations in (D), n=10 for all parameterizations. (E) Fluorescent dextran labeled mesendoderm cells sprinkled on top of an unlabeled DMZ explant reveal cell intercalation toward the substrate level over a 30 min time course confirming model intercalation behavior.
Fig. 6.
Fig. 6.
In-silico disruption of cell–substrate binding results in comparable behavior to biological experiments. (A,B) Top-down (en face) images from the experiment in Davidson et al., 2002 (A) before and (B) after disruption of cell-substrate binding following addition of integrin a5b1 function-blocking mAB P8D4. Similar top-down images from a representative simulation (C) before and (D) after disruption of leader cell–substrate binding. White arrows represent the (B) experimentally observed and (D) simulated retraction direction. Yellow dashed lines in panels A–D are included as a visual guide to DMZ retraction limit. (E) Quantitative comparison of measured retraction distances (mean±s.e.m) from 10 experiments each are shown. Panels A and B are reproduced from Davidson et al. (2002) with permission from the publisher, Elsevier.
Fig. 7.
Fig. 7.
Development of the cohesotaxis voxel selection probability function. (A) Plotted Sigmoid functions from equation 5. (B) Sorted voxels are selected to establish migratory bias by sampling with frequency defined by normalized sigmoid functions in B.

Update of

Similar articles

References

    1. Adhyapok, P., Piatkowska, A. M., Norman, M. J., Clendenon, S. G., Stern, C. D., Glazier, J. A. and Belmonte, J. M. (2021). A mechanical model of early somite segmentation. iScience 24, 102317. 10.1016/j.isci.2021.102317 - DOI - PMC - PubMed
    1. An, G., Mi, Q., Dutta-Moscato, J. and Vodovotz, Y. (2009). Agent-based models in translational systems biology. Wiley Interdiscip. Rev. Syst. Biol. Med. 1, 159-171. 10.1002/wsbm.45 - DOI - PMC - PubMed
    1. Ataliotis, P., Symes, K., Chou, M. M., Ho, L. and Mercola, M. (1995). PDGF signalling is required for gastrulation of Xenopus laevis. Development 121, 3099-3110. 10.1242/dev.121.9.3099 - DOI - PubMed
    1. Belmonte, J. M., Swat, M. H. and Glazier, J. A. (2016). Filopodial-Tension Model of Convergent-Extension of Tissues. PLoS Comput. Biol. 12, e1004952. 10.1371/journal.pcbi.1004952 - DOI - PMC - PubMed
    1. Bornschlögl, T., Romero, S., Vestergaard, C. L., Joanny, J.-F., Van Nhieu, G. T. and Bassereau, P. (2013). Filopodial retraction force is generated by cortical actin dynamics and controlled by reversible tethering at the tip. Proc. Natl. Acad. Sci. USA 110, 18928-18933. 10.1073/pnas.1316572110 - DOI - PMC - PubMed

LinkOut - more resources