. 2024 Oct;43(19):4197-4227.
doi: 10.1038/s44318-024-00203-4. Epub 2024 Aug 19.

Histone demethylase KDM2A recruits HCFC1 and E2F1 to orchestrate male germ cell meiotic entry and progression

Affiliations

Histone demethylase KDM2A recruits HCFC1 and E2F1 to orchestrate male germ cell meiotic entry and progression

Shenglei Feng et al. EMBO J. 2024 Oct.

Abstract

In mammals, the transition from mitosis to meiosis facilitates the successful production of gametes. However, the regulatory mechanisms that control meiotic initiation remain unclear, particularly in the context of complex histone modifications. Herein, we show that KDM2A, acting as a lysine demethylase targeting H3K36me3 in male germ cells, plays an essential role in modulating meiotic entry and progression. Conditional deletion of Kdm2a in mouse pre-meiotic germ cells results in complete male sterility, with spermatogenesis ultimately arrested at the zygotene stage of meiosis. KDM2A deficiency disrupts H3K36me2/3 deposition in c-KIT+ germ cells, characterized by a reduction in H3K36me2 but a dramatic increase in H3K36me3. Furthermore, KDM2A recruits the transcription factor E2F1 and its co-factor HCFC1 to the promoters of key genes required for meiosis entry and progression, such as Stra8, Meiosin, Spo11, and Sycp1. Collectively, our study unveils an essential role for KDM2A in mediating H3K36me2/3 deposition and controlling the programmed gene expression necessary for the transition from mitosis to meiosis during spermatogenesis.

Keywords: Fertility; Histone Modification; KDM2A; Male Germ Cells; Meiosis.


Conflict of interest statement

The authors declare no competing interests.

Figures
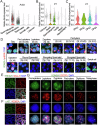
Figure 1
Figure 1. KDM2A displays a dynamic expression pattern during spermatogenesis.
(AC) Scatter plots showing the expression of Kdm2a in different types of testicular cell populations based on previously reported single-cell RNA-seq data in adult (A) and P7 mouse testes (B, C). SPG1, 2, 3, 4 correspond to SSCs (spermatogenic stem cells), undifferentiated spermatogonia, early differentiating spermatogonia and late differentiating spermatogonia, respectively. (D) Anti-KDM2A and anti-γH2AX antibodies were used for double immunostaining of wild-type (WT) testicular cells from adult testicular cryosections. Spotted lines show the indicated cell type. Nuclei were stained with DAPI. Scale bars = 10 μm. (E, F) Co-immunofluorescence staining of SALL4 (E) and c-KIT (F) with KDM2A in WT testis sections from P10 mice are shown. Nuclei were stained with DAPI. Scale bars = 50 μm. (G) Double immunostainings with KDM2A and SYCP3 on surface-spread spermatocytes from WT P21 mice are shown. Nuclei were stained with DAPI. Scale bars = 5 μm. Biologically independent mice (n = 3) were examined in three separate experiments (DG). Source data are available online for this figure.
Figure 2
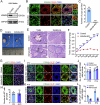
Figure 2. Conditional knockout of Kdm2a in germ cells causes male sterility.
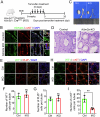
(A) Western Blotting (WB) analyses of KDM2A protein levels in control and Kdm2a cKO adult testes using GAPDH as a loading control. (B) Immunofluorescence (IF) staining of KDM2A in control and Kdm2a cKO testes of adult mice. DDX4 was co-stained to indicate the location of the germ cell. Enlarged images are shown in right panels. Arrowheads indicate KDM2A signals in the DDX4 positive cells. The DNA was stained with DAPI. Scale bars = 50 μm. (C) Histograms show the average number of pups per litter when control and Kdm2a cKO adult male mice were mated with WT female mice. Data are presented as mean ± SD, n = 7. P value was calculated using a two-tailed Student’s t-test. ***P < 0.0001. (D) Gross morphology of testes and epididymides from adult control and Kdm2a cKO mice. (E) Periodic acid-Schiff (PAS) staining of testes and epididymides from control and Kdm2a cKO adult mice. Spg: spermatogonia, Ser: Sertoli cells, Spc: spermatocytes, RS: round spermatids, ES: elongated spermatids. Scale bars = 50 μm. (F) Testis growth curves of control and Kdm2a cKO mice from postnatal day 7 (P7) to P56. Data are presented as mean ± SD, n = 3 (three biological replicates). P value was calculated using a two-tailed Student’s t-test. ns, not significant. ***P < 0.0001. (G) Co-immunofluorescent staining of c-KIT (green) with DDX4 (red) on testis sections from control and Kdm2a cKO mice at P10. Scale bars = 50 μm. (H) Quantification of c-KIT+ cells per tubule for (G). Data are presented as mean ± SD, n = 6 biological replicates. P value was calculated using a two-tailed Student’s t-test. ns, not significant. (I) Co-immunofluorescent staining of STRA8 (green) with PLZF (red) on testis sections from control and Kdm2a cKO mice at P10. Scale bars = 50 μm. (J) Quantification of PLZF+ and STRA8+ cells per tubule for (I). Data are presented as mean ± SD, n = 6 biological replicates. P value was calculated using a two-tailed Student’s t-test. ns, not significant. (K) Co-immunofluorescent staining of STRA8 (green) with PLZF (red) on testis sections from control and Kdm2a cKO mice at P14. Scale bars = 50 μm. (L) Quantification of PLZF- and STRA8+ cells per tubule for (K). Data are presented as mean ± SD, n = 6 biological replicates. P value was calculated using a two-tailed Student’s t-test. **P  =  0.0045, ***P  =  0.0008. All images are representative of n = 3 mice per genotype. Source data are available online for this figure.
Figure 3
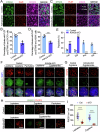
Figure 3. KDM2A is required for progression of male meiosis.
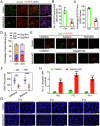
(A) Co-immunostaining of STRA8 (green), PLZF (red), and SYCP3 (purple) in testis sections from control and Kdm2a cKO mice at P10. The DNA was stained with DAPI. Scale bars = 50 μm. (B) Quantification of the number of seminiferous tubules that have PLZF-, STRA8+, and SYCP3+ cells per total seminiferous tubules for (A). Data are presented as mean ± SD, n = 6 biological replicates. P value was calculated using a two-tailed Student’s t-test. ***P < 0.0001. (C) Immunostaining of STRA8 (green), PLZF (red), and γH2AX (purple) in testis sections from control and Kdm2a cKO mice at P10. The DNA was stained with DAPI. Lep, leptotene spermatocytes. Prelep, preleptene spermatocytes. Scale bars = 50 μm. (D) Quantification of the number of seminiferous tubules that have PLZF-, STRA8+, and γH2AX+ cells per total seminiferous tubules for (C). Data are presented as mean ± SD, n = 6 biological replicates. P value was calculated using a two-tailed Student’s t-test. ***P < 0.0001. (E) Percentages of spermatocytes at the leptotene (Lep), zygotene (Zyg), pachytene (Pac), and diplotene (Dip) stages from control and Kdm2a cKO mice at P21. Data are presented as mean ± SD. n = 3 biological replicates. P value was calculated using a two-tailed Student’s t-test. left to right: ***P = 0.001, ***P < 0.0001, ***p  = 0.0002, ***P = 0.0002. (F) Co-immunofluorescent staining of SYCP3 with γH2AX in spermatocyte chromosome spreads from control and Kdm2a cKO mice at P18. Nuclei were stained with DAPI. Scale bars = 5 μm. (G) Chromosome spreads of control zygotene spermatocytes and Kdm2a cKO zygotene-like cells at P18 were stained for SYCP3 and SYCP1. Scale bars = 5 μm. Abnormal SYCP1 signals accumulated in unsynapsed sister chromatids in Kdm2a cKO mice are indicated by the white arrow. (H) Spermatocyte spreads from control and Kdm2a cKO testes at P18 were stained for SYCP3 and RAD51. Scale bars = 5 μm. (I) Scatter plot showing the numbers of RAD51 foci per cell on SYCP3 axes in leptotene and zygotene spermatocytes for (H). Data are presented as mean ± SD. A total of n  =  28 control leptotema, n  =  30 Kdm2a cKO leptotema, n  =  25 control zygonema, and n  =  29 Kdm2a cKO zygonema were counted from three biologically independent mice for each genotype. P value was calculated using a two-tailed Student’s t-test. ***P < 0.0001. Source data are available online for this figure.
Figure 4
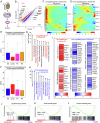
Figure 4. Transcriptome analysis of Kdm2a cKO mice.
(A) Schematic of the isolation of c-KIT+ differentiating spermatogonia cells from P10 control and Kdm2a cKO testes. (B) Scatter plot of the transcriptome of c-KIT+ cells in control versus Kdm2a cKO mice is shown. n = 3 (three biological replicates). The numbers of differentially expressed genes (DEGs) are shown (P < 0.05, fold change >1.5). Significantly upregulated and downregulated genes in the Kdm2a cKO cells are labeled with red and blue color, respectively. DESeq2 Wald test P value was calculated. (C, D) Heatmaps showing the hierarchical relationship among the clusters of DEGs across pseudotime of spermatogenesis. Expressions of the upregulated genes (C) and the downregulated genes (D) in c-KIT+ cells of Kdm2a cKO mice were assessed by reanalyzing scRNA-seq data of spermatogenic cells. Pseudotime (left to right) corresponds to the developmental trajectory of spermatogenesis (undifferentiated spermatogonia to round spermatids). (E, F) Expression levels (RPKM) of the 1934 upregulated genes (E) and the 1922 downregulated genes (F) in c-KIT+ cells of Kdm2a cKO mice are shown by box-whisker plot (whiskers indicate min and max. Bounds of box indicate 25th and 75th percentiles quantile with median). The upregulated and downregulated genes in Kdm2a cKO were reanalyzed with the previously published data of stage-specific bulk RNA-seq (n  =  3 biologically independent samples). SG spermatogonia, L/Z SC leptotene/zygotene spermatocytes, PS pachytene spermatocytes, RS round spermatid. (G, H) Gene ontology (GO) analyses of the upregulated genes (G) and downregulated genes (H) in c-KIT+ cells of Kdm2a cKO mice. Colored terms represent key biological processes related to the development of spermatogenic cells. P-values were calculated by using gene ontology functions of HOMER software. (I) Heatmap showing up- and down-regulated genes in Kdm2a cKO c-KIT+ cells identified by GO analysis. (JL) GSEA of RNA-seq data for the control and Kdm2a cKO c-KIT+ cells. Selected gene sets encoded products related to upregulated genes during meiosis (J), Stra8-activated genes (K), or Meiosin-activated genes (L). n = 3 biologically independent samples for each group. NES normalized enriched score. Permutation test on enrichment score was performed following Subramanian algorithm. Nominal P-value = 0.
Figure 5
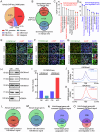
Figure 5. Ablation of KDM2A in germ cells results in the dysregulation of H3K36me2/3.
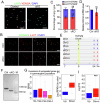
(A) Distribution of Kdm2a binding sites from Kdm2a CUT&RUN-sequencing (CUT&RUN-seq) in c-KIT-positive cells from P10 WT testes. (B) Venn diagram representing the overlap of Kdm2a targets genes (CUT&RUN-seq data) and differentially expressed genes (RNA-seq data). (C) GO analyses of the top 10 most enriched biological processes based on their P-values combine upregulated genes (our RNA-seq data) with Kdm2a target genes (CUT&RUN-seq). P-values were calculated by using gene ontology functions of HOMER software. (D) GO analyses of the top 10 most enriched biological processes based on their P-values combine downregulated genes (our RNA-seq data) with Kdm2a target genes (CUT&RUN-seq). P-values were calculated by using gene ontology functions of HOMER software. (EG) Co-immunofluorescent staining of H3K36me1 (E), H3K36me2 (F), and H3K36me3 (G) with c-KIT in testis sections from control and Kdm2a cKO mice at P10 are shown, respectively. The DNA was stained with DAPI. Enlarged images are shown on the right panel. Arrows indicate c-KIT+ spermatogonia. Scale bars = 50 μm. (H) WB analyses the expression of H3K36me1, H3K36me2, and H3K36me3 in c-KIT+ cells isolated from control and Kdm2a cKO mice at P10. H3 was served as loading control. (I) Barplot of the peaks distribution of H3K36me2 and H3K36me3 CUT&RUN-seq c-KIT+ cells isolated from control and Kdm2a cKO mice at P10. (J, K) Average H3K36me2 (J) or H3K36me3 (K) CUT&RUN signals of control and Kdm2a cKO c-KIT-positive cells within –2 kb/+2 kb of TSS. (L, M) Venn diagram depicting the overlap of Kdm2a bound genes in WT c-KIT-positive cells and genes with increased H3K36me3 signal (L) or genes with decreased H3K36me2 signal (M) in Kdm2a cKO c-KIT-positive cells. (N) Venn diagram showing the overlap between Kdm2a-bound genes with increased H3K36me3 signal genes and Kdm2a-bound upregulated genes. (O) Venn diagram showing the overlap of Kdm2a-bound genes with increased H3K36me3 signal genes and Kdm2a-bound downregulated genes. Source data are available online for this figure.
Figure 6
Figure 6. KDM2A interacts with HCFC1 and E2F1 to regulate gene expression in germ cells.
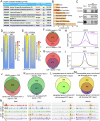
(A) A list of eight KDM2A-interacting partners with highest score in sorted c-KIT+ cells identified by immunoprecipitation-mass spectrometry (IP-MS). (B) GO analyses of KDM2A-interacting proteins identified from IP-MS data. (C) Validation of interactions between KDM2A and two putative KDM2A-interacting proteins (HCFC1 and E2F1) in purified c-KIT-positive cells by co-IP assays. IgG was used as a negative control. (D, E) Heatmap of HCFC1 and E2F1 expression levels in control and Kdm2a cKO c-KIT-poistive cells. HCFC1 and E2F1 expression levels are shown on the genomic regions between −2.0 kb upstream and +2.0 kb downstream of TSS. (F) Venn diagram showing the overlap between Kdm2a-bound genes and the Hcfc1-bound genes in TSS region. (G) Venn diagram showing the overlap between the Hcfc1-bound genes and the E2f1-bound genes in TSS region. (H, I) Average HCFC1 (H) or E2F1 (I) CUT&RUN signals of Kdm2a cKO c-KIT-positive cells versus control c-KIT-positive cells within –2 kb/+2 kb of TSS. (J) Venn diagram shows an overlapping of Kdm2a-bound genes of TSS in WT c-KIT-positive cells and genes with decreased HCFC1 signal of TSS in Kdm2a cKO c-KIT-positive cells. (K) Venn diagram depicting the overlap of genes in TSS region with decreased HCFC1 and E2F1 signal occupancy in Kdm2a cKO c-KIT-positive cells. (L) Venn diagram showing the overlap between upregulated genes with decreased HCFC1 and E2F1 signal in Kdm2a cKO c-KIT-positive cells. (M) Venn diagram showing the overlap between downregulated genes with decreased HCFC1 and E2F1 signal in Kdm2a cKO c-KIT-positive cells. (N) Genome browser tracks depicting reads accumulation of HCFC1 and E2F1 on representative meiotic genes Stra8, Spo11, Sycp1, and Meiosin in control and Kdm2a cKO c-KIT-positive cells using IGV software. Source data are available online for this figure.
Figure 7
Figure 7. KDM2A recruits HCFC1 and E2F1 on the promoter of target genes.
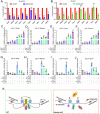
(A, B) RIP-qPCR analyses of the association of the selected gene mRNAs with HCFC1 (A) and E2F1 (B) in control and Kdm2a cKO c-KIT-positive cells are shown. Biologically independent mice (n = 3) were examined in three separate experiments. Data are presented as mean ± SD. P value was calculated using a two-tailed Student’s t-test. ns, not significant. For (A), left to right: ***P = 0.0006, ***P < 0.0001, ***P < 0.0001, ***P < 0.0001, ***P = 0.0002, ***P = 0.0005, ***P = 0.0001, ***P < 0.0001, **P = 0.0051; For (B), left to right: ***P < 0.0001, ***P =  0.0001, ***P < 0.0001, ***P = 0.0001, ***P = 0.0005, ***P = 0.0004, ***P = 0.0001, ***P = 0.0001. Source data are available online for the RIP-qPCR. (CF) Luciferase reporter gene assays show that when Kdm2a, Hcfc1, and E2f1 were overexpressed in different combinations, the luciferase activity of the Stra8 (C), Meiosin (D), Sycp1 (E), and Spo11 (F) promoter regions in HEK293T cells was significantly increased. Data were presented as mean ± SD. n = 3 biological replicates. P value was calculated using a two-tailed Student’s t-test. ns, not significant. For (C), left to right: *P = 0.0160, **P = 0.0060, ***P = 0.0007, **P = 0.001; For (D), left to right: **P = 0.0021, ***P = 0.0009, **P  = 0.0012, ***P < 0.0001, ***P   =  0.0009; For (E), left to right: *P  =  0.0144, **P = 0.0080, **P = 0.0010, ***P = 0.0007, ***P < 0.0001; For (F), left to right: *P = 0.0103, ***P = 0.0005, **P = 0.0022, ***P = 0.0003, ***P = 0.0007. (GJ) Luciferase reporter gene assays show that when Kdm2a, Hcfc1, and E2f1 were knocked down in different combinations, the luciferase activity of the Stra8 (G), Meiosin (H), Sycp1 (I), and Spo11 (J) promoter regions in HEK293T cells was remarkable decreased. Data were presented as mean ± SD. n = 3 biological replicates. P value was calculated using a two-tailed Student’s t-test. ns, not significant. For (G), left to right: **P = 0.0030, ***P = 0.0001, ***P  = 0.0002, **P = 0.0068, ***P = 0.0004; For (H), left to right: ***P < 0.0001, **P = 0.0025, ***P < 0.0001, **P = 0.0010, **P = 0.0094, ***P < 0.0001; For (I), left to right: ***P = 0.0001, ***P = 0.0004, ***P < 0.0001, **P = 0.0037, *P = 0.0140, **P = 0.0063; For (J), left to right: **P < 0.0023, ***P = 0.0008, ***P < 0.0001, ***P = 0.0007, ***P < 0.0001. (K) Schematic working model of the KDM2A, HCFC1, and E2F1 complexes that regulate the completion of the meiotic prophase I. Source data are available online for this figure.
Figure EV1
Figure EV1. The expression pattern of KDM2A and H3K36me1/2/3 during spermatogenesis.
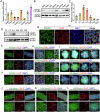
(A) RT-qPCR analyses of Kdm2a mRNA levels in various organs from wild-type (WT) adult mice. n = 3 (three biological replicates). Data are presented as the mean ± SD. (B) WB analyses the expression of KDM2A protein levels in multiple organs from WT adult mice. GAPDH was used as a loading control. Biologically independent mice (n = 3) performed three independent experiments. Data are presented as the mean ± SD. (C) RT-qPCR analyses of Kdm2a mRNA levels in WT testes at different developmental stages including postnatal day 0 (P0), P7, P14, P21, P28, P35, and adult. n = 3 (three biological replicates). (D) WB analyses the KDM2A protein levels in developing WT testes. GAPDH served as a loading control. Biologically independent mice (n = 3) performed three separate experiments. (E) Whole-mount staining of seminiferous tubules from adult WT testis with antibodies against KDM2A and PLZF. Nuclei were stained with DAPI. Scale bars = 50 μm. Examples of Asingle (As), Apaired (Apr), and Aaligned (Aal(4), Aal(8)) undifferentiated spermatogonia in adult testes (dotted circles). (F) same as (E) for adult WT testes, but with antibodies against KDM2A and c-KIT. Nuclei were stained with DAPI. Scale bars = 50 μm. (G) Co-Immunofluorescent staining of KDM2A and PLZF on testis sections from WT mice at P14. Nuclei were stained with DAPI. Scale bars = 50 μm. (H) Co-Immunofluorescent staining of SALL4 with H3K36me1 (upper), H3K36me2 (middle), and H3K36me3 (lower) on testis sections from WT mice at P14, respectively. Nuclei were stained with DAPI. Scale bars = 50 μm. The white arrows indicate the SALL4+ spermatogonia. (I) Co-Immunofluorescent staining of SYCP3 with H3K36me1 (upper), H3K36me2 (middle), and H3K36me3 (lower) on surface-spread spermatocytes from WT mice at P21, respectively. Nuclei were stained with DAPI. Leptotene (Lep), Zygotene (Zyg), Pachytene (Pac), and Diplotene (Dip) spermatocytes are shown. Scale bars = 5 μm. (JL) Co-Immunofluorescent staining of PLZF with H3K36me1 (J), H3K36me2 (K), and H3K36me3 (L) on whole-mount testes seminiferous tubules from adult WT mice. Nuclei were stained with DAPI. Scale bars = 50 μm. Source data are available online for this figure.
Figure EV2
Figure EV2. Kdm2a deletion results in defective differentiation of adult spermatogonia.
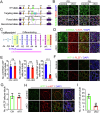
(A) Schematic diagram of the targeting strategy used to generate floxed Kdm2a allele by homologous recombination in mouse embryonic stem cells. (B) Immunofluorescence (IF) staining of KDM2A and DDX4 in control and Kdm2a cKO testes of P5 and P8 mice. Scale bars = 50 μm. (C) The Schematic diagram of spermatogonial differentiation process. As, A-single; Apr, A-paired; Aal, A-aligned; Int, intermediary spermatogonia; B, B spermatogonia; prL, preleptotene spermatocytes; and L, leptotene spermatocytes. (D) Co-immunofluorescent staining of STRA8 with c-KIT on testis sections from P10 control and Kdm2a cKO mice. Nuclei were stained with DAPI. Scale bars = 50 μm. (E) The quantifications of STRA8+ c-KIT+ or STRA8- c-KIT+ or STRA8+ c-KIT- cells per tubule. Data were presented as the mean ± SD. n = 3 biological replicates. P value was calculated using a two-tailed Student’s t-test. ns, not significant. ***P  = 0.0004. (F) Co-immunofluorescent staining of WT1 with PLZF on testis sections from adult control and Kdm2a cKO mice. Nuclei were stained with DAPI. Scale bars = 50 μm. (G) Quantification of PLZF+ cells per tubule for (F). Data were presented as the mean ± SD. n = 3 biological replicates. P value was calculated using a two-tailed Student’s t-test. ns, not significant. (H) Co-immunofluorescent staining of WT1 with c-KIT on testis sections from adult control and Kdm2a cKO mice. Nuclei were stained with DAPI. Scale bars = 50 μm. (I) Quantification of c-Kit+ cells per tubule for (H). Data were presented as the mean ± SD. n = 3 biological replicates. P value was calculated using a two-tailed Student’s t-test. ns, not significant. **P  = 0.0016. Source data are available online for this figure.
Figure EV3
Figure EV3. Tamoxifen-induced Kdm2a deletion in adult mice affects spermatogonial differentiation.
(A) Regimen of tamoxifen treatment in adult (2 M) Kdm2afl/− Ddx4-CreERT2 male mice. (B) Immunofluorescence (IF) staining of KDM2A and c-KIT in control and Kdm2a iKO testes. Arrowheads indicate KDM2A signals in the c-KIT positive cells. Nuclei were stained with DAPI. Enlarged images are shown in right panels. Scale bars = 50 μm. (C) Gross morphology of testes and epididymides from control and Kdm2a iKO mice. (D) Periodic acid-Schiff (PAS) staining of testes from control and Kdm2a-iKO mice. Scale bars = 50 μm. (E) Co-immunofluorescent staining of WT1 with PLZF on testis sections from adult control and Kdm2a iKO mice. Nuclei were stained with DAPI. Scale bars = 50 μm. (F, G) Quantification of WT1+ and PLZF+ (G) cells per tubule for (E). Data were presented as the mean ± SD. n = 3 biological replicates. P value was calculated using a two-tailed Student’s t-test. ns, not significant. (H) Co-immunofluorescent staining of WT1 with c-KIT on testis sections from adult control and Kdm2a iKO mice. Nuclei were stained with DAPI. Scale bars = 50 μm. (I) Quantification of c-Kit+ cells per tubule for (H). Data were presented as the mean ± SD. n = 3 biological replicates. P value was calculated using a two-tailed Student’s t-test. ns, not significant. **P = 0.0083. Source data are available online for this figure.
Figure EV4
Figure EV4. Kdm2a deletion results in defective meiosis initiation and progression.
(A) Co-immunostaining of SYCP3 with γH2AX in testis sections from control and Kdm2a cKO mice at P14. Nuclei were stained with DAPI. Scale bars = 50 μm. (B, C) The quantifications of SYCP3+ and γH2AX+ cells per tubule (B) and the percentage of SYCP3+ and γH2AX+ tubule (C) are shown. Data were presented as the mean ± SD. n = 3 biological replicates. P value was calculated using a two-tailed Student’s t-test. ns, not significant. For (B), ***P  = 0.003; For (C), ***P < 0.0001. (D) The percentage of spermatocytes at the leptotene (Lep), zygotene (Zyg), and pachytene (Pac) stages for (Fig. 3D). Data were presented as the mean ± SD. n = 3 biological replicates. (E) Spermatocyte spreads from control and Kdm2a cKO testes at P18 were co-stained SYCP3 and DMC1. Scale bars = 50 μm. (F) A scatter plot shows the number of DMC1 foci per cell on SYCP3 axes in leptotene and zygotene spermatocytes from control and Kdm2a cKO mice, respectively. Data are presented as the mean ± SD. A total of n  =  30 control leptotema, n  =  29 Kdm2a cKO leptotema, n  =  29 control zygonema, and n  =  30 Kdm2a cKO zygonema were counted from three biologically independent mice for each genotype. P value was calculated using a two-tailed Mann–Whitney U-test. left to right: ***P < 0.0001, ***P < 0.0001. (G) TUNEL staining of testis sections from control and Kdm2a cKO mice at P10, P12, and P14. Nuclei were stained with DAPI. Scale bars = 50 μm. (H) Quantification of apoptotic cells per tubule for (G). Data were presented as the mean ± SD. n = 3 biological replicates. P value was calculated using a two-tailed Student’s t-test. left to right: ***P = 0.0003, ***P < 0.0001, ***P = 0.0002. Source data are available online for this figure.
Figure EV5
Figure EV5. Verification of KDM2A deletion in isolated c-KIT cells from Kdm2a cKO testes.
(A) Co-immunofluorescence staining of anti-c-KIT with anti-KDM2A on isolated differentiated spermatogonal from control and KDM2A cKO mice. Nuclei were stained with DAPI. Scale bars = 50 μm. (B) Co-immunofluorescence staining of anti-STRA8 with anti-c-KIT on isolated differentiated spermatogonal from P10 control and Kdm2a cKO mice. Nuclei were stained with DAPI. Scale bars = 50 μm. (C) The percentage of c-KIT- STRA8+ and c-KIT+STRA8+ spermatogonia from control and Kdm2a cKO mice. Data were presented as the mean ± SD. n = 3 biological replicates. P value was calculated using a two-tailed Student’s t-test. ns, not significant. (D) RT-qPCR analyses of Kdm2a mRNA levels in isolated differentiated spermatogonal from P10 control and Kdm2a cKO mice. Data were presented as the mean ± SD. n = 3 biological replicates. P value was calculated using a two-tailed Student’s t-test. ns, not significant. (E) Genome browser tracks depicting peaks of the region containing exon6 of Kdm2a based on RNA-seq. (F) RT-PCR analyses of Kdm2a mRNA in isolated c-KIT spermatogonia from control and Kdm2a cKO mice. (G) Expression levels (RPKM) of the upregulated 1934 genes in different types of spermatogonia (SG1-4) were reanalyzed with the previously published data of stage-specific bulk RNA-seq (N  =  3 biologically independent samples). Whiskers indicate min and max. Bounds of box indicate 25th and 75th percentiles quantile with median. SPG 1, 2, 3, 4 correspond to SSCs (spermatogenic stem cells), undifferentiated spermatogonia, early differentiating spermatogonia and late differentiating spermatogonia, respectively. (H) Expression levels (RPKM) of the 1934 upregulated and 1922 downregulated genes in control (c-KIT+ cells of P10 control mice) are shown by box-whisker plot (whiskers indicate min and max. Bounds of box indicate 25th and 75th percentiles quantile with median). Data were presented as the mean ± SD. P value was calculated using an unpaired two-tailed Student’s t-test. ***P < 0.0001. (I) Fold change of the 1934 upregulated and 1922 downregulated genes from RNA-seq are shown by box-whisker plot (whiskers indicate min and max. Bounds of box indicate 25th and 75th percentiles quantile with median). Data were presented as the mean ± SD. P value was calculated using an unpaired two-tailed Student’s t-test. ***P < 0.0001. Source data are available online for this figure.

Similar articles

References

    1. Adams IR, Davies OR (2023) Meiotic chromosome structure, the synaptonemal complex, and infertility. Annu Rev Genomics Hum Genet 24:35–61 - PubMed
    1. Ballare C, Lange M, Lapinaite A, Martin GM, Morey L, Pascual G, Liefke R, Simon B, Shi Y, Gozani O et al (2012) Phf19 links methylated Lys36 of histone H3 to regulation of Polycomb activity. Nat Struct Mol Biol 19:1257–1265 - PMC - PubMed
    1. Cheng Z, Cheung P, Kuo AJ, Yukl ET, Wilmot CM, Gozani O, Patel DJ (2014) A molecular threading mechanism underlies Jumonji lysine demethylase KDM2A regulation of methylated H3K36. Genes Dev 28:1758–1771 - PMC - PubMed
    1. da Cruz I, Rodriguez-Casuriaga R, Santinaque FF, Farias J, Curti G, Capoano CA, Folle GA, Benavente R, Sotelo-Silveira JR, Geisinger A (2016) Transcriptome analysis of highly purified mouse spermatogenic cell populations: gene expression signatures switch from meiotic-to postmeiotic-related processes at pachytene stage. BMC Genomics 17:294 - PMC - PubMed
    1. Dimitrova E, Turberfield AH, Klose RJ (2015) Histone demethylases in chromatin biology and beyond. EMBO Rep 16:1620–1639 - PMC - PubMed

LinkOut - more resources