. 2024 Oct;43(19):4298-4323.
doi: 10.1038/s44318-024-00198-y. Epub 2024 Aug 19.

CHC22 clathrin recruitment to the early secretory pathway requires two-site interaction with SNX5 and p115

Affiliations

CHC22 clathrin recruitment to the early secretory pathway requires two-site interaction with SNX5 and p115

Joshua Greig et al. EMBO J. 2024 Oct.

Abstract

The two clathrin isoforms, CHC17 and CHC22, mediate separate intracellular transport routes. CHC17 performs endocytosis and housekeeping membrane traffic in all cells. CHC22, expressed most highly in skeletal muscle, shuttles the glucose transporter GLUT4 from the ERGIC (endoplasmic-reticulum-to-Golgi intermediate compartment) directly to an intracellular GLUT4 storage compartment (GSC), from where GLUT4 can be mobilized to the plasma membrane by insulin. Here, molecular determinants distinguishing CHC22 from CHC17 trafficking are defined. We show that the C-terminal trimerization domain of CHC22 interacts with SNX5, which also binds the ERGIC tether p115. SNX5, and the functionally redundant SNX6, are required for CHC22 localization independently of their participation in the endosomal ESCPE-1 complex. In tandem, an isoform-specific patch in the CHC22 N-terminal domain separately mediates binding to p115. This dual mode of clathrin recruitment, involving interactions at both N- and C-termini of the heavy chain, is required for CHC22 targeting to ERGIC membranes to mediate the Golgi-bypass route for GLUT4 trafficking. Interference with either interaction inhibits GLUT4 targeting to the GSC, defining a bipartite mechanism regulating a key pathway in human glucose metabolism.

Keywords: CHC22; Clathrin; Golgi bypass; Sorting nexin 5; p115.


Conflict of interest statement

The authors declare no competing interests.

Figures
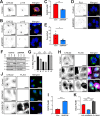
Figure 1
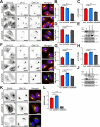
Figure 1. SNX5/6 levels correlate with localization of CHC22 to perinuclear membranes.
(A) Representative images of control HeLa cells immunolabeled for CHC22 (red in merged), and p115 (green in merged) with single channels in black and white. Merged image shows all channels with overlap in yellow and includes DAPI-stained nuclei (blue). Arrow indicates the compartment overlap in the perinuclear region. Two concentric white circles mark the boundary of the perinuclear area measured using the perinuclear mean intensity (PeriMI) method. (B) Representative images of control parental HeLa cell line (top) and CRISPR-mediated SNX5/6 null (ΔSNX5/6) HeLa-derived line (bottom) immunolabeled for CHC22 (green in merged) and p115 (magenta in merged), nuclei stained with DAPI (blue in merged). (C) Quantification of PeriMI for CHC22 in the cell lines shown in (B). Each bar represents the mean normalized PeriMI value for three independent experiments represented individually as dots (10–20 cells per genotype, per experiment). Statistical analysis was performed using a two-tailed Student’s t test with Welch’s correction (P = 0.0095). (D) Representative images of control parental HeLa line (top) and ΔSNX5/6 HeLa-derived line (bottom), with CHC22 and p115 targeting antibodies labelled using Proximity Ligation Assay (PLA) probes. PLA-positive puncta are shown in black and white in single channel images and in yellow in merged, with DAPI-stained nuclei (blue). (E) Quantification of the CHC22-p115 PLA puncta shown in (D) measuring the average number of puncta per cell between the genotypes. Each bar represents the median for each genotype from four independent experiments, with each repeat individually depicted as a dot (23–51 cells per genotype, per experiment). Statistical analysis was performed using a two-tailed Student’s t test with Welch’s correction (P = 0.0307). (F) Representative immunoblot for membrane fractionation of lysate from control HeLa cells (left) and ΔSNX5/6 HeLa cells (right) immunoblotted for CHC22, CHC17, transferrin receptor (TfR), HSC70, and tubulin. Lanes show the input, cytosolic (Cyto) fraction, and membrane (Mem) fraction respectively. The migration positions of molecular weight (MW) markers are indicated at the left in kilodaltons (kD). (G) Quantification of the percentage of CHC22, CHC17, and HSC70 protein associated with cellular membranes ([Mem/(Mem+Cyto)]x100) for control (C) and ΔSNX5/6 (Δ) cells. Graphs show mean ± SEM. Statistical analysis was performed using a two-tailed Student’s t test with Welch’s correction (P = 0.0002, P = 0.94, P = 0.49 from left to right, n = 3 independent experiments). (H) Representative images of control HeLa cells either mock-transfected (top) or transfected to overexpress FLAG-SNX5 (SNX5 OE) (middle and bottom). Two rows are shown to demonstrate the range of transfection effects. Cells were immunolabeled for CHC22 (green in merged) and FLAG (magenta in merged) with single channels shown in black and white and nuclei stained with DAPI (blue in merged). (I) Quantification of CHC22 PeriMI for mock (Con)- and FLAG-SNX5 (OE)-transfected HeLa cells. Each bar represents the mean normalized PeriMI value from three independent experiments, each individually depicted as dots (14–25 cells per condition, per experiment). Statistical analysis was performed using a two-tailed Student’s t test with Welch’s correction (P < 0.0001). (J) Representative images of mock-transfected HeLa cells (top), mock-transfected ΔSNX5/6 HeLa cells (middle), and ΔSNX5/6 HeLa cells transfected to overexpress FLAG-SNX5 (ΔSNX5/6 + SNX5 OE) (bottom). Cells were immunolabeled for CHC22 (green in merged) and FLAG (not shown in merged, for clarity) with single channels shown in black and white and nuclei stained with DAPI (blue in merged). (K) Quantification of CHC22 PeriMI for HeLa mock-transfected cells (Con), ΔSNX5/6 HeLa mock-transfected cells, and ΔSNX5/6 HeLa cells transfected to overexpress FLAG-SNX5 (Δ + SNX5 OE) shown in (J). Each bar represents the mean normalized PeriMI value from three independent experiments, each individually depicted as dots (8–17 cells per genotype, per experiment). Statistical analysis was performed using a one-way ANOVA with a Tukey post-hoc test (P < 0.0001 for all three). ns = not significant; *P < 0.05; **P < 0.01; ***P < 0.001; ****P < 0.0001. Scale bars: 25 µm. Source data are available online for this figure.
Figure 2
Figure 2. SNX5/6-dependent CHC22 localization is independent of both VPS35 retromer and SNX1/2 components of the ESCPE-1 complex.
(A) Representative images of control parental HeLa cell line (top), VPS35-null (ΔVPS35) HeLa-derived line (middle), and ΔSNX5/6 HeLa-derived line (bottom) immunolabeled for CHC22 (red in merged), p115 (magenta in merged) and GM130 (green in merged) with overlap of labels (yellow) and DAPI-stained nuclei (blue) in merged. (BD) Quantification of PeriMI for CHC22 (B) (P = 0.0534 (ns), P < 0.0001(****)), p115 (C) (P = 0.6734 (ns), P = 0.0004 (****)), and GM130 (D) (P < 0.0001 (****), P = 0.1133 (ns)), in control, ΔVPS35, and ΔSNX5/6 HeLa cells. Each bar represents the mean normalized PeriMI value from three independent experiments, each individually depicted as dots (18–29 cells per genotype, per experiment). Statistical analysis was performed using a one-way ANOVA with a Tukey post-hoc test. (E) Representative immunoblot of lysates from control (con), ΔVPS35 and ΔSNX5/6 HeLa lines immunoblotted for CHC22, GM130, p115, and tubulin. Normalized mean optical density (OD) values for CHC22 from 3 experiments are shown. The migration position of MW markers is indicated at the left in kilodaltons (kD). (F) Representative images of control parental HeLa cell line (top), ΔSNX1/2 HeLa-derived line (middle), and ΔSNX5/6 HeLa-derived line (bottom) immunolabeled for CHC22 (red in merged), p115 (magenta in merged) and GM130 (green in merged) with overlap of labels (yellow) and DAPI-stained nuclei (blue) in merged. (GI) Quantification of PeriMI for CHC22 (G) (P < 0.0001(****), P = 0.0085 (**)), p115 (H) (P = 0.1519 (ns), P = 0.0231 (*)), and GM130 (I) (P = 0.0006 (***), P = 0.1094 (ns)), in control, ΔSNX1/2, and ΔSNX5/6 HeLa cells. Each bar represents the mean normalized PeriMI value from three experiments, each individually depicted as dots (15–26 cells per genotype, per experiment). Statistical analysis was performed using a one-way ANOVA with a Tukey post-hoc test. (J) Representative immunoblot of lysates from parental HeLa control cells (con), ΔSNX1/2 cells and ΔSNX5/6 cells immunoblotted for CHC22, GM130, p115, and tubulin. Normalized mean OD values for CHC22 from 3 experiments are shown. The migration positions of MW markers are indicated at the left in kD. (K) Representative images of control parental HeLa line (top), ΔSNX1/2 HeLa-derived line (middle) and ΔSNX5/6 HeLa-derived line (bottom) immunolabeled for SNX6 (red in merged) and GM130 (green in merged) with overlap of labels (yellow) and DAPI-stained nuclei (blue) in merged. (L) Quantification of PeriMI for SNX6 in control, ΔSNX1/2, and ΔSNX5/6 HeLa cells. Each bar represents the mean normalized PeriMI value from three independent experiments, each individually depicted as dots (16–27 cells per genotype, per experiment). Statistical analysis was performed using a one-way ANOVA with a Tukey post-hoc test (P = 0.0067 (**), P < 0.0001 (****)). ns = not significant; *P < 0.05; **P < 0.01; ***P < 0.001; ****P < 0.0001. Scale bars: 25 µm. Source data are available online for this figure.
Figure 3
Figure 3. SNX5 binds directly to CHC22 at the trimerization domain.
(A, B) Representative immunoblot (n = 4–6) of immunoprecipitates (IP) of CHC22, from control HeLa cells (A) and differentiated human skeletal muscle cell line AB1190 (Myotubes) (B). Samples were immunoblotted for CHC22, SNX5, SNX6, and tubulin. Lanes show Input (5%), bead-only (no antibody) control (Bead) and CHC22 immunoprecipitate (22 IP). The migration positions of MW markers are indicated at the left in kilodaltons (kD). (C) The structure of a single clathrin triskelion formed from three clathrin heavy chains with the Hub region indicated by red dotted triangle and the trimerization domain (TxD), magenta), proximal leg region (dark blue), knee and distal leg regions (grey) and terminal domain (light blue), based on PDB 31YV (Fotin et al, 2004). (D) AlphaFold-generated model of the interaction between CHC22 Hub (blue proximal leg residues 1278–1519 and magenta TxD residues 1520–1640) and the BAR domain of SNX5 (residues 202–404, orange). Two angles of view are displayed. (E) Representative immunoblot (n = 3–5) of in vitro binding of full-length GST-SNX5 (right lanes) or GST alone (left lanes) to CHC22 Hub (22 Hub) or CHC17 Hub (17 Hub) immobilized on Ni-NTA beads. Purified protein input (2%) and bead-only (no Hub immobilized) control (Bead) are shown for each prey. Samples were immunoblotted for SNX5, His-tag or GST with detected proteins indicated at the right. The position of MW markers is indicated at the left in kD. (F) Representative immunoblot of in vitro binding of full-length GST-SNX5 (right lanes) or GST alone (left lanes) to CHC22 Hub or CHC22 TxD immobilized on Ni-NTA beads (n = 3). Purified protein input (2%) and beads without CHC22 fragment added (Bead) are shown for each prey. Samples were immunoblotted for SNX5, His-tag or GST with detected proteins indicated at the right. The position of MW markers is indicated at the left in kD. Source data are available online for this figure.
Figure 4
Figure 4. CHC22 TxD and SNX1 compete for binding to SNX5 at the interface where SNX5 participates in the ESCPE-1 complex.
(A) AlphaFold-generated model of the SNX1-SNX5 BAR domains interaction in the ESCPE-1 complex (SNX1 BAR residues 299–516 in cyan, SNX5 BAR residues 203–399 in orange). (B) Overlay of SNX5-SNX1 BAR domain heterodimer with SNX5 BAR bound to the CHC22 Hub as predicted by AlphaFold (CHC22 proximal legs in blue, TxD in magenta). (C) Schematic cartoon of assay testing whether SNX1 binding to SNX5 can compete with TxD binding to SNX5. Full-length GST-tagged SNX5 was bound to beads and exposed first to full-length His-tagged SNX1, then His-tagged CHC22 TxD was added and its binding was detected by immunoblotting with antibody against CHC22 TxD. (D) Representative immunoblot (n = 3) of the in vitro competition assay shown in (C), testing effects of increasing amounts (μg) of His-SNX1 added to GST-SNX5 on His-CHC22 TxD binding. The left six lanes show background binding when no GST-SNX5 was added to the beads. Samples were immunoblotted for GST, His-tag, or CHC22 with detected proteins indicated at the right. The position of MW markers is indicated at the left in kilodaltons (kD). (E) Representative immunoblot of the in vitro binding of purified His-CHC22 TxD (22 TxD) to immobilized full-length GST-SNX5 wild-type and phosphomimetic S226E mutant. Increasing amounts of His-CHC22 TxD, ranging from 4 to 16 µg, were added to bead-only control (Bead), GST-SNX5 WT (WT), and GST-SNX5 S226E (S226E). Samples were immunoblotted for SNX5 or CHC22 and detected proteins indicated at the right. His-CHC22 TxD input (0.1 µg) is shown on the far left and the position of MW markers is indicated in kD. (F) Quantification of the binding signals of His-CHC22 TxD to GST-SNX5 WT (red) and S226E (blue), as shown in (E). The TxD binding signals were calculated by subtracting the value of the appropriate bead-only condition and subsequently normalized to the His-CHC22 TxD input signal. Error bars display the standard error of the mean (n = 8). Source data are available online for this figure.
Figure 5
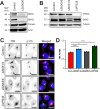
Figure 5. SNX5 directly binds p115 and their interaction mediates CHC22 localisation.
(A) Representative immunoblot (n = 4) of CHC22 immunoprecipitates from control parental HeLa (left) and ΔSNX5/6 HeLa-derived lines (right) immunoblotted for CHC22, p115, and tubulin. Lysate input (5%), bead-only (no antibody) control (Bead) and CHC22 immunoprecipitate (22 IP) are shown for each cell line. The migration positions of MW markers are indicated at the left in kilodaltons (kD). (B) Representative immunoblot (n = 4) of CHC22 immunoprecipitates from ΔSNX1/2 HeLa-derived line (left) and ΔVPS35 HeLa-derived line (right) immunoblotted for CHC22, p115, and tubulin. Lysate input (5%), bead-only (no antibody) control (Bead) and CHC22 immunoprecipitate (22 IP) are shown for each cell line. The migration positions of MW markers are indicated at the left in kD. (C) Representative images of control parental HeLa line transfected with non-targeting siRNA (control, top), control parental HeLa line transfected with siRNA targeting p115 (p115 KD, second row), ΔSNX5/6 cells transfected with siRNA targeting p115 (Δ + p115 KD, third row), and ΔSNX5/6 cells transfected with siRNA targeting p115 and FLAG-SNX5-encoding plasmid (Δ + p115 KD + SNX5, bottom). Cells were immunolabeled for CHC22 (magenta in merged), GM130 (green in merged) and FLAG (not shown in merged for clarity) with overlap shown in white and DAPI-stained nuclei (blue) in merged. Scale bars: 25 µm. (D, E) Quantification of PeriMI for CHC22 (D) (P < 0.0001 (****), P = 0.0016 (**), P = 0.1091 (ns)) and GM130 (E) (P < 0.0001 (****), P = 0.0163 (*), P = 0.0002 (***)) for HeLa cells transfected with non-targeting siRNA (Con), HeLa cells transfected with p115 siRNA (p115 KD), ΔSNX5/6 cells transfected with p115 siRNA (Δ + p115 KD), and ΔSNX5/6 cells transfected with p115 siRNA and FLAG-SNX5-encoding plasmid (Δ+ p115 KD + SNX5) as shown in (C). Each bar represents the mean normalized PeriMI value from three independent experiments, each individually depicted as dots (11–24 cells per condition, per experiment). Statistical analysis was performed using a one-way ANOVA with a Tukey post-hoc test. (F) Representative immunoblot (n = 3 independent experiments) of in vitro binding of full-length SNX5 (GST-SNX5) or GST to p115 (His-p115) on Ni-NTA beads. Samples were immunoblotted for SNX5, p115 or GST and detected proteins indicated at the right. Input (2%) and bead-only (no p115 containing lysate added) control (Bead) are shown for each prey. The position of MW markers is indicated at the left in kD. ns = not significant; *P < 0.05; **P < 0.01; ***P < 0.001; ****P < 0.0001. Source data are available online for this figure.
Figure 6
Figure 6. The N-terminal domain (TD) of CHC22 is also required for correct localisation and binds p115 directly.
(A) Representative images of control parental HeLa cells mock-transfected (Control-top), HeLa cells transfected with sfGFP-CHC22 wild-type expression plasmid (WT-middle), and HeLa cells transfected with sfGFP-ΔTD-CHC22 expression plasmid (ΔTD-bottom). Cells were imaged for GFP (green in merged) and immunolabeled for p115 (red in merged) with red-green overlap in yellow and DAPI-stained nuclei (blue) in merged. Scale bars: 25 µm. (B) A schematic of the encoded CHC22 constructs showing the location of the N-terminal sfGFP tag and the deletion of the TD (bottom). (C) Quantification of Pearson’s colocalization for CHC22 and p115, in cells expressing full-length sfGFP-CHC22 (CHC22) or sfGFP-ΔTD-CHC22 (CHC22 ΔTD). Each bar represents the mean Pearson’s colocalization value from three independent experiments, each individually depicted as dots (14–25 cells per condition, per experiment). Statistical analysis was performed using a two-tailed Student’s t test with Welch’s correction (P = 0.0154). (D) Representative immunoblot (n = 3) of anti-GFP immunoprecipitates (GFP nanotrap beads) from HeLa cells mock-transfected (Mock) or transfected with CHC22 WT (sfGFP-CHC22-WT), CHC22ΔTD (sfGFP-CHC22-ΔTD) or CHC17 WT (eGFP-CHC17-WT). Lysate input (5%) and immunoprecipitate (IP) are shown for each condition. Samples were immunoblotted for GFP or p115 as indicated at the right. The migration positions of MW markers are indicated at the left in kD. (E) Intensity of the p115 signal for each IP in (D), normalized relative to the GFP signal (p115/GFP) (n = 3 independent experiments). (F) Coomassie-stained SDS-PAGE gel of the purified CHC TDs (CHC22 TD or CHC17 TD). 1 µg of protein loaded in each lane. (G) A representative immunoblot of in vitro binding of His-SUMO-tagged CHC22 terminal domain (CHC22 TD) to GST only (GST), the clathrin-binding fragment of GGA2 tagged with GST (GST-GGA2-HE) and full-length GST-p115 bound to glutathione beads. CHC22 TD input (0.4%) is far left and background samples with only Buffer added (no TD) are shown. Samples were immunoblotted for the His-tag (top) or GST (bottom). The migration position of MW markers is indicated at the left in kD (n = 3). (H) A representative immunoblot (n = 3) of in vitro binding of His-SUMO CHC17 terminal domain (CHC17 TD) to GST, GST-GGA2-HE and full-length GST-p115 immobilized on glutathione beads. CHC17 TD input (0.4%) is far left and background samples with only Buffer added (no TD) are shown. Samples were immunoblotted for the His-tag (top) or GST (bottom). The migration position of MW markers is indicated at the left in kD. Note, due to differing background binding of CHC17 and CHC22 TDs to GST alone, pulldowns in (G, H) were carried out in different buffers (see methods). *P < 0.05. Source data are available online for this figure.
Figure 7
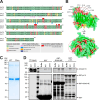
Figure 7. Divergent N-terminal domain (TD) residues are responsible for direct CHC22 recruitment by p115.
(A) Sequence homology analysis between human CHC22 and CHC17 TDs. Regions of shared sequence for residues 1–330 are shown in green, yellow represents conservative amino acid substitutions, while red denotes radical amino acid differences between CHC22 and CHC17. Colored blocks above and below the protein sequences denote residues involved in the known adaptor-binding sites of CHC17 and in the predicted divergent patch on the CHC22 TD, as indicated in the key. (B) A model of the CHC22 TD based on the solved CHC17 TD crystal structure (PDB: 1BPO) showing the positioning of the patch of divergent residues identified from comparison with the CHC17 TD in (A) (all differences with CHC17 color-coded in red and yellow as above with surface cluster of nine non-conservative differences denoted by dashed circle). (C) Coomassie-stained SDS-PAGE gel of the purified wild-type CHC22 TD (WT) and Chimeric CHC22 TD (Chim) with the nine patch residues mutated to those in CHC17. 1 µg of protein loaded in each lane with molecular weight (MW) marker migration positions indicated in kilodaltons (kD) at the left. (D) A representative immunoblot (n = 3) of in vitro binding of purified His-SUMO-tagged CHC22 TD fragments (WT or Chim) to GST-only, the purified clathrin-binding fragment of the adaptor GGA2 (GST-GGA2-HE) and full-length p115 (GST-p115) immobilized on glutathione beads. Inputs of the CHC22 TD constructs (0.4%) and the MW ladder marker lane (x) are shown along with background buffer-only signal (Buffer, no TD added) for each immobilized bait. Samples were immunoblotted for the His-tag (top) or GST (bottom). The position of MW markers is indicated at the left in kD. The section on the left (comprising the TD inputs and the GST) is transferred from the same gel as the section on the right (GST-GGA2-H-E and GST-p115) and the membrane has been cropped in the middle for clarity. Source data are available online for this figure.
Figure 8
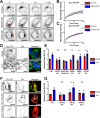
Figure 8. Both SNX5- and TD-mediated recruitment of CHC22 are necessary for function of the insulin-responsive GLUT4 storage compartment.
(AC) Dynamics of GLUT4–GFP measured by FRAP in the HeLa HA-GLUT4-GFP (HeLa G4) stably-transfected cell line. (A) A representative example of FRAP in HeLa G4 cells transfected with control non-targeting siRNA (Control), HeLa G4 cells transfected with siRNA targeting both SNX5 and SNX6 (SNX5/6 KD), and HeLa G4 cells transfected with siRNA targeting VPS35 (VPS35 KD). Panels in (A) show the position of the bleach spot (P, red circle) and the Nucleus (N, blue dashed ellipse) at the pre-bleach timepoint (T-1), bleach timepoint (T 0), and at the end timepoint (T 100). Time is in seconds. (B) Quantification of the HA-GLUT4-GFP fluorescence recovery post-bleaching between Control and SNX5/6 KD transfected HeLa GLUT4-GFP cells. Average recovery curves (mean ± SEM) and the best-fit curves (solid lines) are shown (n = 3, 7–11 cells per experiment, per condition). Analysis was performed using a nonlinear regression, with a sum of squares F-test (P < 0.0001). (C) Quantification of the HA-GLUT4-GFP fluorescence recovery post-bleaching between Control and VPS35 KD transfected HeLa GLUT4-GFP cells. Average recovery curves (mean ± SEM) and the best-fit curves (solid lines) are shown (n = 3, 8–11 cells per experiment, per condition). Analysis was performed using a nonlinear regression, with a sum of squares F-test (P = 0.061). (D) Representative images of control HeLa G4 cells without (Basal) or with insulin treatment ( + Insulin). Total GLUT4 imaged using GFP tag (green in merged), surface GLUT4 detected by live immunolabeling the exofacial HA tag (magenta in merged), with GFP overlap in white and DAPI-stained nuclei (blue) in merged. (E) Quantification of the HA-GLUT4-GFP surface-to-total ratio (HA:GFP) using median fluorescent signal (MFI). HeLa GLUT4-GFP cells were transfected with control non-targeting siRNA (Con) or transfected with siRNA (KD) targeting CHC22, SNX5 and SNX6, SNX5 only, SNX6 only, or VPS35, and then treated with vehicle only (Basal) or insulin ( + Ins). Bar height represents the mean value for all experiments in each condition. Each dot represents the normalized MFI value, relative to control, for all cells in each individual experiment. Statistical analysis was performed using a two-tailed Student’s t test with Welch’s correction between cells of the same experimental condition which were either vehicle only or insulin-treated (P = 0.683, P = 0.358, P = 0.002, P = 0.012, P = 0.05 from left to right, n = 3, 10,000 cells per condition, per experiment). (F) Representative images of control HeLa G4 cells depleted for endogenous CHC22 by siRNA treatment then transfected to express siRNA-resistant wild-type CHC22-mApple (WT) or siRNA-resistant CHC22-mApple with a terminal domain deletion (ΔTD) without (Basal) or with insulin treatment ( + Insulin). Total GLUT4 was imaged using GFP tag (green in merged), CHC22-mApple constructs were imaged using Apple tag (red in merged), and surface GLUT4 was detected by live immunostaining the exofacial HA tag (magenta in merged). (G) Quantification of the HA-GLUT4-GFP surface-to-total ratio (HA:GFP) using median fluorescent signal (MFI). HeLa GLUT4-GFP cells were either transfected with control non-targeting siRNA (Con) or transfected with siRNA (KD) targeting CHC22 alone (CHC22 KD) or combinations of siRNA targeting CHC22 plus constructs encoding siRNA resistant CHC22 WT or CHC22 ΔTD. These were then treated with vehicle only (Basal) or insulin ( + Ins). Bar height represents the mean value for all experiments in each condition. Each dot represents the normalized MFI value, relative to control, for all cells in each individual experiment. Statistical analysis was performed using a two-tailed Student’s t test with Welch’s correction between cells of the same experimental condition which were either vehicle only or insulin-treated (P = 0.961, P = 0.049, P = 0.79 from left to right, n = 4, 20,000 cells per condition, per experiment). ns = not significant; *P < 0.05; **P < 0.01; ****P < 0.0001. Scale bars: 25 µm. Source data are available online for this figure.
Figure 9
Figure 9. Model of the bipartite mechanism for CHC22 recruitment to ERGIC membranes.
Diagram of how sequential interactions of CHC22 with p115 could recruit CHC22 to membranes of the Endoplasmic Reticulum-Golgi intermediate compartment membranes (ERGIC) for GLUT4 sequestration. The trimerization domain of CHC22 binds SNX5, which in turn binds p115 (interaction denoted by 1). This positions the N-terminal domain of CHC22 to directly bind p115 through a unique patch (asterisk) that diverges from the CHC17 sequence (interaction denoted by 2). Disruption of either interaction abrogates CHC22 recruitment and function. The ERGIC membrane is distinguished by the localization of p115. Through the interaction of p115 with IRAP, this complex (described previously) is linked to the capture of GLUT4 and its sorting to an insulin-responsive intracellular compartment upon assembly of the CHC22 coat at the ERGIC membrane.
Figure EV1
Figure EV1. Phenotype validation of knock-out HeLa cell lines used in the study and the distribution of transferrin receptor (TfR).
(A) Representative immunoblot (n = 2) of lysates from parental HeLa cells (Control, left) and CRISPR knock-out SNX5/6 HeLa cells (ΔSNX5/6, right) immunoblotted for SNX5, SNX6, tubulin, and actin. The migration positions of MW markers are indicated at the left in kilodaltons (kD). (B) Immunoblot of lysates from parental HeLa (Control, left) and CRISPR knock-out cell lines; SNX5/6, SNX1/2, and VPS35 (ΔSNX5/6, ΔSNX1/2, ΔVPS35) immunoblotted for SNX2, VPS35, and tubulin. The migration positions of MW markers are indicated at the left in kD. (C) Representative images of parental HeLa line (top), ΔSNX1/2 HeLa-derived line (second row), ΔSNX5/6 HeLa-derived line (third row), and ΔVPS35 HeLa-derived line (bottom) immunolabeled for TfR (magenta in merged) and p115 (green in merged) with label overlap in white and DAPI-stained nuclei (blue) in merged. Scale bars: 25 µm. (D) Quantification of PeriMI for TfR in the HeLa lines shown in (A). Each bar represents the mean normalized PeriMI value from three independent experiments, each individually depicted as dots (12–23 cells per genotype, per experiment). Statistical analysis was performed using a one-way ANOVA with a Tukey post-hoc test (P < 0.0001(****), P = 0.0326 (*)).
Figure EV2
Figure EV2. CHC22 is not complexed with the Retromer and ESCPE-1 components VPS35 and SNX1.
Representative immunoblot (n = 3) of CHC22 immunoprecipitate (IP) from HeLa cells. Samples were immunoblotted for CHC22, VPS35, SNX1, and tubulin. Lysate input (5%), bead-only (no antibody) control (Bead) and CHC22 immunoprecipitate (22 IP) are shown. The migration positions of MW markers are indicated at the left in kilodaltons (kD).
Figure EV3
Figure EV3. Binding of SNX6 to CHC22 TxD predicted by AlphaFold and confirmation of SNX5 mutant loss of binding to SNX1.
(A, B) Comparison of the AlphaFold-generated models of the interaction between CHC22 Hub (blue proximal leg residues 1278–1519 and magenta TxD residues 1520–1640) and the BAR domain of SNX5 (residues 202–404, orange) (A) or SNX6 (residues 205–406, orange) (B). (C) Coomassie-stained SDS-PAGE gel of GST (arrowhead) and GST-SNX5 (hollow circle) used for in vitro pulldown assays in Figs. 3E,F and 5F. 1 µg protein per lane. (D) Coomassie-stained SDS-PAGE gel of His-SNX1 (arrowhead) and His-22TxD (hollow circle) used in the competition binding assay in Fig. 4D. 1 µg protein per lane. (E) Representative immunoblot (n = 2) of the in vitro binding of purified full-length His-SNX1 to immobilized full-length GST-SNX5 wild-type or full-length GST-SNX5 phosphomimetic S226E mutant. His-SNX1 was added to bead-only control (Bead), GST-SNX5 WT (WT), or GST-SNX5 S226E mutant (S226E). Samples were immunoblotted for GST (top) or the His-tag (bottom) and detected proteins indicated at the right. The positions of MW markers (C-E) are indicated in kD at the left.
Figure EV4
Figure EV4. Protein depletion by siRNA targeting p115, SNX5, SNX6, and VPS35 used in this study.
(A) Representative images of HeLa cells transfected with control non-targeting siRNA (Control, top), and cells transfected with siRNA targeting p115 (p115 KD, bottom). Cells were immunolabeled for p115 (green in merged with DAPI-stained nuclei, blue). (B) Representative immunoblot of lysates from HeLa cells transfected with control non-targeting siRNA (Control, left) and HeLa cells transfected with siRNA targeting SNX5 (SNX5 KD, left) immunoblotted for SNX5 and tubulin. The migration positions of MW markers are indicated at the left in kD. (C) Representative images of HeLa cells transfected with control non-targeting siRNA (Control, top) and cells transfected with siRNA targeting SNX6 (SNX6 KD, bottom). Cells were immunolabeled for SNX6 (green in merged with DAPI-stained nuclei, blue. (D) Representative images of HeLa cells transfected with control non-targeting siRNA (Control, top) and cells transfected with siRNA targeting VPS35 (VPS35 KD, bottom). Cells were immunolabeled for VPS35 (green in merged with DAPI-stained nuclei, blue. Scale bars: 25 µm.

Similar articles

References

    1. Alam MS (2018) Proximity Ligation Assay (PLA). Curr Protoc Immunol 123:e58 - PMC - PubMed
    1. Bogan JS (2012) Regulation of glucose transporter translocation in health and diabetes. Annu Rev Biochem 81:507–532 - PubMed
    1. Bolte S, Cordelieres FP (2006) A guided tour into subcellular colocalization analysis in light microscopy. J Microsc 224:213–232 - PubMed
    1. Briant K, Redlingshöfer L, Brodsky FM (2020) Clathrin’s life beyond 40: connecting biochemistry with physiology and disease. Curr Opin Cell Biol 65:141–149 - PubMed
    1. Camus SM, Camus MD, Figueras-Novoa C, Boncompain G, Sadacca LA, Esk C, Bigot A, Gould GW, Kioumourtzoglou D, Perez F et al (2020) CHC22 clathrin mediates traffic from early secretory compartments for human GLUT4 pathway biogenesis. J Cell Biol 219:e201812135 - PMC - PubMed

LinkOut - more resources