[Preprint]. 2024 Aug 11:2024.08.11.607362.
doi: 10.1101/2024.08.11.607362.

Predicting the translation efficiency of messenger RNA in mammalian cells

Affiliations

Predicting the translation efficiency of messenger RNA in mammalian cells

Dinghai Zheng et al. bioRxiv. .

Abstract

The degree to which translational control is specified by mRNA sequence is poorly understood in mammalian cells. Here, we constructed and leveraged a compendium of 3,819 ribosomal profiling datasets, distilling them into a transcriptome-wide atlas of translation efficiency (TE) measurements encompassing >140 human and mouse cell types. We subsequently developed RiboNN, a multitask deep convolutional neural network, and classic machine learning models to predict TEs in hundreds of cell types from sequence-encoded mRNA features, achieving state-of-the-art performance (r=0.79 in human and r=0.78 in mouse for mean TE across cell types). While the majority of earlier models solely considered 5' UTR sequence, RiboNN integrates contributions from the full-length mRNA sequence, learning that the 5' UTR, CDS, and 3' UTR respectively possess ~67%, 31%, and 2% per-nucleotide information density in the specification of mammalian TEs. Interpretation of RiboNN revealed that the spatial positioning of low-level di- and tri-nucleotide features (i.e., including codons) largely explain model performance, capturing mechanistic principles such as how ribosomal processivity and tRNA abundance control translational output. RiboNN is predictive of the translational behavior of base-modified therapeutic RNA, and can explain evolutionary selection pressures in human 5' UTRs. Finally, it detects a common language governing mRNA regulatory control and highlights the interconnectedness of mRNA translation, stability, and localization in mammalian organisms.

Keywords: Deep learning; Machine learning; Ribosome profiling; Translation efficiency; Translational regulation.


Conflict of interest statement

DECLARATION OF INTERESTS D.Z., J.W., F.M., and V.A. are employees of Sanofi and may hold shares and/or stock options in the company.

Figures
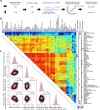
Fig. 1.
Fig. 1.. Integrative analysis of thousands of human and mouse ribosomal profiling datasets measuring TE.
a) Schematic showing the workflow of transcriptome-wide TE calculations for the human and mouse, using paired RNA-seq and ribosome profiling datasets. b) Heatmap of Spearman correlation coefficients comparing TEs derived from each pair of 78 human cell types. Cell types are clustered using hierarchical clustering. Right panel barplots show quality control data for the human cell type shown in each row. c) Comparison of mean TEs (i.e., averaged across human cell types) for mRNAs derived from this study relative to alternative measurements of translational output measured in prior studies,,. The Pearson (r) and Spearman (rho) correlation coefficients between each pair of measurements is also shown.
Fig. 2.
Fig. 2.. A classical machine learning approach to predict mammalian TEs from mRNA sequence.
a) UpSet plot showing the R2 metric measured on ten held-out CV folds of LGBM models which predict the mean TE across human cell types using various feature sets. Colored feature sets are indicative of those that contributed to the optimal sequence-only model. Median R2 and statistically significant differences in performance between pairs of models are indicated. P-values were calculated using one-sided, paired t-tests adjusted with a Bonferroni correction. All additional feature sets considered, but that did not have a significant improvement on performance, are labeled as “Other”. b-c) Importance of the features used by the optimal sequence-only model (shown as a red bar in panel a) for both the human (b) and mouse (c). For a given feature, importance was measured as the sum total information gain across all splits using the feature, averaged across all folds. The colors of the bars correspond to the mean Spearman rho, averaging rho values between the features and TE values from each cell type. Feature names are colored according to the feature set to which they belong. d-e) Scatter plots comparing the predicted and observed mean TEs, averaged across cell types, for both the human (d) and mouse (e). The Pearson (r) and Spearman (rho) correlation coefficients, integrating the results across ten CV folds, are also shown.
Fig. 3.
Fig. 3.. Performance and interpretation of deep learning models predicting mammalian TEs from mRNA sequence.
a) Architecture of RiboNN, a deep multitask convolutional neural network trained to predict TEs of mRNAs in numerous cell types from an input of the mRNA sequence and an encoding of the first frame of each codon. b-c) Performance of RiboNN in predicting human (b) and mouse (c) mean TEs, averaged across cell types. The Pearson (r) and Spearman (rho) correlation coefficients, integrating the results across ten CV folds, are also shown. d) Comparison of different model training strategies for predicting TEs in individual cell types. The following approaches were examined: LGBM trained on a single task, RiboNN trained in either a multitask or single task setting, and RiboNN trained in a multitask setting but then fine-tuned on a single task (i.e., a “transfer learning” approach). e) Metagene plot summarizing the absolute value of attribution scores, averaging across all mRNAs, for percentiles along the 5′ UTR, CDS, and 3′ UTR. mRNAs were grouped into one of 4 equally sized bins according to their mean TE. f) Insertional analysis of 16 dinucleotides and the AUG motif. Motifs were inserted into each of 100 equally spaced positional bins along the 5′ UTR, CDS, and 3′ UTRs of each mRNA. Indicated is the average predicted change in TE for each bin plotted along a metagene. g) This panel is the same as panel f), except it performs analysis for 61 codons (excluding the 3 stop codons) inserted into the first reading frame along the length of the CDS. h-k) Scatter plots showing the relationship between the codon influence (i.e., the predicted effect size of each inserted codon, averaged across all positional bins) from the human RiboNN model with that of the mouse model (h), mean codon stability coefficients (i), A-site ribosome occupancy scores (j), and tRNA abundances (k). Pearson (r) and Spearman (rho) correlation coefficients are also shown.
Fig. 4.
Fig. 4.. RiboNN predicts the impact of RNA modifications, genetic variants, and reporter constructs on translation.
a) Comparison of HEK293T-predicted TEs relative to mean ribosome load (MRL) as measured by polysome profiling,. b-d) Performance of RiboNN in predicting the ribosomal recruitment score (i.e., association of the 80S ribosomal subunit) to a panel of m1Ψ-modified 5′ UTRs linked to EGFP (b), their corresponding endogenous ORFs (c), or the paired difference between the endogenous and EGFP ORF (d). The Pearson (r) and Spearman (rho) correlation coefficients between each pair of measurements is also shown. e) Relationship between the observed strength of negative selection of uAUG-associated point mutations, as measured by the mutability adjusted proportion of singletons score, and the RiboNN-predicted effect size. uAUG mutations were binned into categories based on the type of ORF created, distance to CDS start position, and association to Kozak consensus sequences of varying strength. Error bars represent confidence intervals calculated using bootstrapping. f-g) In silico mutagenesis results of two 5′ UTR regions of MORC2 (f) and CDKN2A (g). “Gain” alludes to a predicted increase in TE for the mutation, while “Loss” refers to the opposite. Positions of wild type uAUG are highlighted in purple at the top. The known disease associated variant is boxed. Single point mutations resulting in severe change of TE are shown alongside annotations reflecting the corresponding gain or loss of TE.
Fig. 5.
Fig. 5.. Interrelationships between mRNA translation, turnover, and subcellular localization.
a-c) Scatter plots showing the relationship between mean TE and mRNA stability (a), predicted mean TE and mRNA stability (b), and predicted stability and mean TE (c). Pearson (r) and Spearman (rho) correlation coefficients are also indicated. d-f) Boxplots of TE (left panel) and residual TE (i.e., representing the difference between TE and the predicted TE, right panel) for mRNAs binned according to their subcellular localization. Shown are the distributions for mRNAs encoding non-membrane proteins that are enriched in TIS granules (TG+), rough endoplasmic reticulum (ER+), or cytosol (CY+) (d); mRNAs encoding membrane or secreted proteins, with or without predicted signal peptides (SP+/−) (e); or mRNAs enriched in cytosolic processing bodies (P-bodies) (f). p-values were computed by comparing the behavior of mRNAs localized to the specified compartment relative to those not localized (i.e., labeled “None”) using a two-sided Mann-Whitney test adjusted with a Bonferroni correction.

Similar articles

References

    1. Agarwal V. & Shendure J. Predicting mRNA Abundance Directly from Genomic Sequence Using Deep Convolutional Neural Networks. Cell Rep. 31, 107663 (2020). - PubMed
    1. Zhou J. et al. Deep learning sequence-based ab initio prediction of variant effects on expression and disease risk. Nat. Genet. 50, 1171–1179 (2018). - PMC - PubMed
    1. Avsec Ž. et al. Effective gene expression prediction from sequence by integrating long-range interactions. Nat. Methods 18, 1196–1203 (2021). - PMC - PubMed
    1. Linder J., Srivastava D., Yuan H., Agarwal V. & Kelley D. R. Predicting RNA-seq coverage from DNA sequence as a unifying model of gene regulation. bioRxiv 2023.08.30.555582 (2023) doi:10.1101/2023.08.30.555582. - DOI - PubMed
    1. Kelley D. R. et al. Sequential regulatory activity prediction across chromosomes with convolutional neural networks. Genome Res. 28, 739–750 (2018). - PMC - PubMed

Publication types

LinkOut - more resources