. 2024 Aug 10;15(1):6867.
doi: 10.1038/s41467-024-50903-y.

De novo generation of SARS-CoV-2 antibody CDRH3 with a pre-trained generative large language model

Affiliations

De novo generation of SARS-CoV-2 antibody CDRH3 with a pre-trained generative large language model

Haohuai He et al. Nat Commun. .

Abstract

Artificial Intelligence (AI) techniques have made great advances in assisting antibody design. However, antibody design still heavily relies on isolating antigen-specific antibodies from serum, which is a resource-intensive and time-consuming process. To address this issue, we propose a Pre-trained Antibody generative large Language Model (PALM-H3) for the de novo generation of artificial antibodies heavy chain complementarity-determining region 3 (CDRH3) with desired antigen-binding specificity, reducing the reliance on natural antibodies. We also build a high-precision model antigen-antibody binder (A2binder) that pairs antigen epitope sequences with antibody sequences to predict binding specificity and affinity. PALM-H3-generated antibodies exhibit binding ability to SARS-CoV-2 antigens, including the emerging XBB variant, as confirmed through in-silico analysis and in-vitro assays. The in-vitro assays validate that PALM-H3-generated antibodies achieve high binding affinity and potent neutralization capability against spike proteins of SARS-CoV-2 wild-type, Alpha, Delta, and the emerging XBB variant. Meanwhile, A2binder demonstrates exceptional predictive performance on binding specificity for various epitopes and variants. Furthermore, by incorporating the attention mechanism inherent in the Roformer architecture into the PALM-H3 model, we improve its interpretability, providing crucial insights into the fundamental principles of antibody design.


Conflict of interest statement

H.H., B.H., L.G., Y.Z., T.L., and J.Y. are inventors on patent applications related to this work filed by Tencent Technology (Shenzhen) Company Ltd. (Chinese patent applications nos. 202310562554.X, 202311665813.8 and 202311682516.4). H.H., B.H., Y.Z., F.J., and J.Y. are employees of Tencent AI Lab. The authors declare no other competing interests.

Figures

Fig. 1
Fig. 1. Overview of the PALM-H3 and A2binder workflow.
a Schematic of an antibody binding to the epitope region of an antigen. The CDRH3 loop, as the third CDR of the antibody heavy chain, plays an essential role in enabling specific antigen binding. b The framework of PALM-H3. It’s a Transformer-like neural network containing an antigen encoder model and an antibody decoder model. It takes the antigen sequence as input and generates a CDRH3 antibody sequence aiming to bind to the input antigen. The antigen encoder model is an ESM2-based model, which is pre-trained using UniRef50 protein sequences and fine-tuned using antigen sequences. The antibody decoder is a RoFormer-based model, which contains 12 antibody layers that were pre-trained and fine-tuned using antibody sequences. The key (K) and value (V) matrices from the last antigen layer are passed to every antibody layer as the input of the cross-attention sub-layer. c Internal architecture of the antigen layer and antibody layer. Both the antigen layer and antibody layer have two basic sub-layers, including a fully connected feed-forward sub-layer and a multi-head self-attention sub-layer. Additionally, the antibody layer uniquely includes cross-attention sub-layers. Input tokens of each layer are represented by the sum of token embeddings and rotary position embeddings, while the output is a high-dimensional vector representation for each input token. d The cross-attention sub-layer is the key to combining the high-dimensional representation of antigen sequence (K and V matrices) and in-context antibody sequence (Q matrix). e Schematic of the self-supervised pre-training of antibody RoFormer. Unpaired antibody sequences were used to pre-train the antibody RoFormer via masked language modeling. The model was trained to predict the identity of the masked tokens, learning generalizable representations of antibody sequences. f The framework of A2Binder. It takes the antigen sequence along with antibody heavy and light chain sequences as input. Each sequence is encoded by passing through a pre-trained encoder and a Multi-Fusion Convolutional Neural Network (MF-CNN) feature extractor. The MLP (a multilayer perceptron) model finally fuses the features from all three sequences to predict antibody-antigen binding affinity. The architecture of the MF-CNN is shown below.
Fig. 2
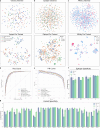
Fig. 2. Comparison of latent capabilities between pre-trained and untrained models and performance comparison of A2Binder versus baseline methods for antibody-antigen binding specificity prediction.
a T-SNE projection of sequence embeddings for antibodies selectively targeting distinct SARS-CoV-2 variants. Antibodies that bound to multiple variants were eliminated. b T-SNE projection of model embeddings for antibodies specifically targeting unique epitopes of SARS-CoV-2. Antibodies that bound to multiple epitopes were eliminated. Antibody sequences used in subgraphs a and b are from CoV-AbDab dataset. c T-SNE projection of model embeddings of antibody sequences with different binding affinity. Each point represents a single antibody sequence from the BioMap dataset, with colors indicating the binding affinity, expressed as Delta G. d, e Receiver operating characteristic (ROC) curve and precision-recall (PR) curve evaluating the overall predictive performance of antibody binding specificity. Models compared include A2Binder, AbMAP, AntiBERTa2, ESM-F, Ens-Grad, and Vanilla BERT. Statistical significance was determined using one-sided t-tests. For the ROC metric, A2binder significantly outperformed the next best method AbMAP (p = 0.0308). For the PR metric, the difference was also significant (p = 0.0082). *P < 0.05, **P < 0.01, and ***P < 0.001, in the comparison with A2binder. Performance breakdown of A2Binder in predicting antibody binding specificity by antigen epitope region (f) and variant (g). The x-axis labels indicate the different epitope categories (f) and variants (g). Experiments were repeated 5 times. Dots represent metric values from individual experiments. Data are presented as mean values +/− SD. The CoV-AbDab dataset was split into training (80%), validation (10%) and test (10%) sets. The results shown in this comparison are based on the test set. Source data are provided as a Source Data file.
Fig. 3
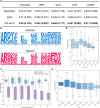
Fig. 3. Performance Comparison with baseline methods and similarity analysis of artificial and natural antibodies.
a Comparison of PALM-H3 with baseline methods, SeqDesign and IgLM, in generating CDRH3 sequences targeting the SARS-CoV-2 RBD. Bold indicates the best results. Values in parentheses represent standard deviation. b Sequence logo of the CDRH3 region in artificial and natural antibodies. The CDRH3 sequences of natural antibodies are sourced from antibodies in the CoV-AbDab dataset that bind to the RBD region of wild-type SARS-CoV-2, while artificial antibodies CDRH3 sequences are obtained by inputting the RBD sequence of the wild-type SARS-CoV-2 to the PALM-H3. c Comparison of A2binder-predicted binding probabilities to the wild-type SARS-CoV-2 RBD region between artificial antibodies and randomly mutated antibodies (n = 800). Artificial antibodies and randomly mutated antibodies with the same Levenshtein distance as natural antibodies are compared. Boxplot showing the distribution of A2binder-predicted binding probabilities across different Levenshtein distances. The x-axis denotes Levenshtein distance and the y-axis shows predicted binding probability. Blue boxes represent artificial antibodies while purple boxes denote randomly mutated antibodies. d A2binder-predicted binding probabilities of artificial antibodies at different BitScore ranges (n = 662). The BitScore measures the sequence similarity between artificial antibodies and natural antibodies binding to the same epitope. The x-axis denotes Bit score ranges and the y-axis shows predicted binding probability. The depth of the color indicates an increase in BitScore. The diamond represents outliers. e A2binder-predicted binding probabilities of artificial antibodies at different Root Mean Square Deviation (RMSD) ranges (n = 662). The RMSD measures the structure similarity between artificial antibodies and natural antibodies binding to the same epitope. The x-axis denotes RMSD ranges and the y-axis shows predicted binding probability. The depth of the color indicates an increase in RMSD value. The diamond represents outliers. In c-e, the top whisker, top of the box, middle line, bottom of the box, and bottom whisker indicate the maximum, 75th percentile, median, 25th percentile, and minimum values, respectively. Source data are provided as a Source Data file.
Fig. 4
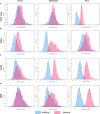
Fig. 4. Comparison of interface energies between the selected high-affinity artificial antibodies predicted by A2binder and natural antibodies targeting the SARS-CoV-2 spike protein across different variants and computational structure generation methods.
Density distribution plots of interface energies for artificial (blue) and natural (red) antibodies binding to the wild-type (a), Alpha (b), Delta (c), and XBB (d) variants of SARS-CoV-2. Results are shown for three different antibody structure generation methods: tFold (left), AbBuilder (middle), and AF2 (right). Interface energies were calculated from 1000 optimized antibody-antigen binding poses using SnugDock. Lower interface energy values indicate more favorable binding. The distributions highlight the ability of computational methods to generate artificial antibodies with binding properties comparable to natural antibodies across multiple spike variants. Source data are provided as a Source Data file.
Fig. 5
Fig. 5. Comparison between PALM-H3 and traditional computational antibody design methods.
a Distribution plot showcasing the Levenshtein distance among antibodies generated using PALM-H3. b A comparison of the time expenditure for antibody design at varying Levenshtein distances from natural antibodies is conducted among Rosetta, Absolute!, and PALM-H3. The top row illustrates various Levenshtein distances, while the subsequent three rows represent the time required by each method to design antibodies at these distances to natural antibodies, measured in CPU hours. c Comparison of the binding affinity, indicated by interface energy, between antibodies produced by PALM-H3 and those generated by E-EVO and EvoEF2. The interface energy values were determined independently through SnugDock.
Fig. 6
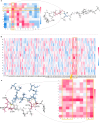
Fig. 6. Interpretability analysis of PALM-H3 in generating antigen-specific antibody CDRH3 sequence.
a Heat maps displaying cross-attention values of PALM-H3 when generating CDRH3 sequence “GRREAAWALA” that targets the epitope “PDVDLGDISGINAS” of SARS-CoV-2. Notably, residue D of the epitope and residue R of the CDRH3 region of the antibody exhibit the highest interaction attention values. Consistent with the cross-attention values, in the binding complexes shown on the right, these two residues form a hydrogen bond link between them. b Heat maps displaying cross-attention values of PALM-H3 when generating CDRH3 sequence “AKDSRTSPLRLDYS” that targets the SARS-CoV-2 variant XBB. c Consistent with the high cross-attention values of the residue 167–177 in the SARS-CoV-2 variant XBB, these residues play important roles in binding to the generated CDRH3. Source data are provided as a Source Data file.
Fig. 7
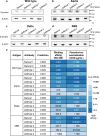
Fig. 7. In-vitro assays of the binding affinity and neutralization of artificial and natural antibodies.
Western blot analysis of artificial and natural antibodies binding to the spike protein of (a) wild-type, (b) Alpha variant, (c) Delta variant, and (d) XBB variant of SARS-CoV-2. HEK293T cells are used to produce pseudotyped vectors. The x-axis indicates the sample of each band, and the y-axis shows the position of antigen binding. Band intensity demonstrates the affinity between the corresponding antibody and antigen. β-Actin bands at the bottom monitor loading consistency across samples. e The result of surface plasmon resonance analysis and pseudovirus neutralization assays of artificial and natural antibodies, and A2binder predictions of the binding probability for the tested artificial and natural antibodies. The color legend on the right indicates value ranges for different colors. Lower KD and IC50 values signify stronger binding affinity and more potent neutralization capability, respectively. Experiments were repeated 3 times independently with similar results. Source data are provided as a Source Data file.

Similar articles

Cited by

References

    1. Zahavi, D. & Weiner, L. Monoclonal Antibodies in Cancer Therapy. Antibodies9, 34 (2020). 10.3390/antib9030034 - DOI - PMC - PubMed
    1. Taylor, P. C. et al. Neutralizing monoclonal antibodies for treatment of COVID-19. Nat. Rev. Immunol.21, 382–393 (2021). 10.1038/s41577-021-00542-x - DOI - PMC - PubMed
    1. Yoo, J.-W., Irvine, D. J., Discher, D. E. & Mitragotri, S. Bio-inspired, bioengineered and biomimetic drug delivery carriers. Nat. Rev. Drug Discov.10, 521–535 (2011). 10.1038/nrd3499 - DOI - PubMed
    1. Imai, K. & Takaoka, A. Comparing antibody and small-molecule therapies for cancer. Nat. Rev. Cancer6, 714–727 (2006). 10.1038/nrc1913 - DOI - PubMed
    1. Wang, Z. et al. Development of therapeutic antibodies for the treatment of diseases. Mol. Biomed.3, 10.1186/s43556-022-00100-4 (2022). - PMC - PubMed

MeSH terms

Supplementary concepts